import numpy as np
import pandas as pd
import yfinance as yf
import matplotlib.pyplot as plt
import matplotlib.dates as mdates
plt.style.use("dark_background")
# USER PARAMETERS
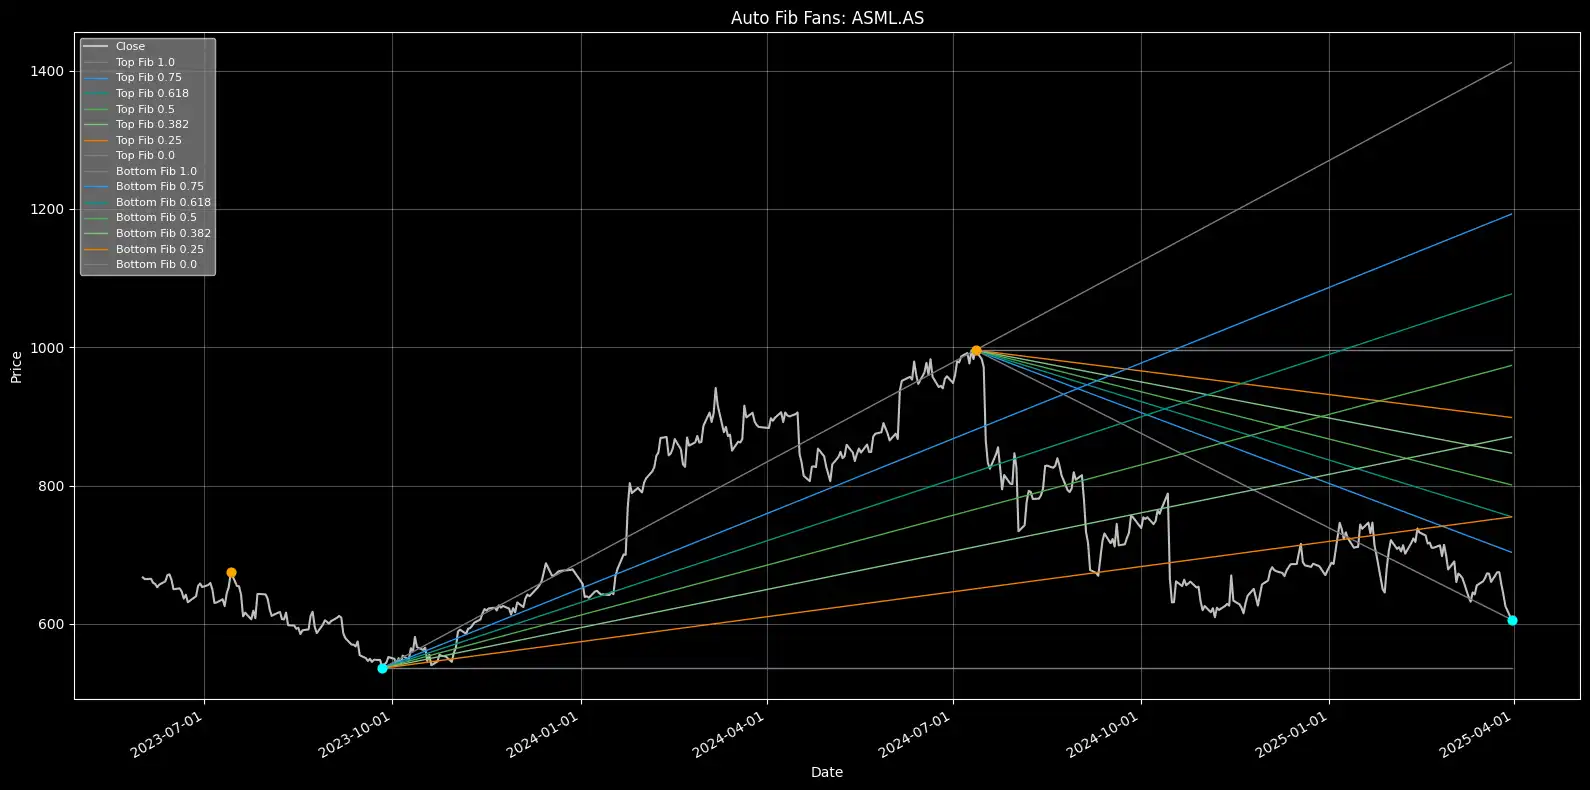
TICKER = "ASML.AS"
START_DATE = "2023-06-01"
END_DATE = "2026-03-01"
INTERVAL = "1d"
# How sensitive the pivot detection should be.
# Higher values = fewer pivots (only big moves count), lower values = more pivots.
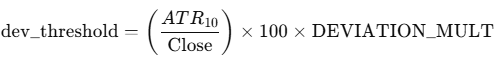
DEVIATION_MULT = 3.0
# Fibonacci fan levels to plot (as ratios)
FIB_LEVELS = [1.0, 0.75, 0.618, 0.5, 0.382, 0.25, 0.0]
REVERSE_FANS = False # If True, the fan lines will be flipped (mirrored logic).
# Control whether to show top fans (from highs) and/or bottom fans (from lows).
draw_top_fans = True
draw_bottom_fans = True
# Choose which pivot the fan lines should start from.
# Example: if you set this to 1, the fan will start from the highest (or lowest) pivot found.
# Set to 2 if you want the second highest/lowest, and so on.
# This lets you control which swing point to use for drawing the fans.
top_origin_selection = 1
bottom_origin_selection = 1
# FIB COLORS
fib_colors = {
1.0: "#787b86",
0.75: "#2196f3",
0.618: "#009688",
0.5: "#4caf50",
0.382: "#81c784",
0.25: "#f57c00",
0.0: "#787b86"
}