Experience the Future of Intelligent Investing Today
Back To Top
Experience the Future of Intelligent Investing Today
Amid the vast arsenal of tools and techniques stands the K-Reversal Indicator — an unassuming, yet remarkably effective instrument. In this article, we not only demystify its mechanics but also showcase its practical implementation, enabling you to enhance your trading arsenal.
Historically, market behavior has always been a blend of quantifiable data and human sentiment. The oscillation between optimism and caution has invariably been a driving force behind price movements.
The K-Reversal Indicator was borne out of the need to quantify these shifts in sentiment. Its genesis can be traced back to seasoned traders’ intuitive observations, which, over time, have been refined and formalized into the tool we recognize today.
At the heart of the K-Reversal lies a straightforward formula. It calculates the relative position of the current closing price concerning its high and low over a predetermined period. Represented mathematically:

Equation. 1: K-Reversal Indicator Formula
Where:
By tracking the K value, traders can discern potential reversals in stock trends. When K values are extremely low, it might suggest a potential uptrend, whereas exceedingly high values could hint at a downtrend.

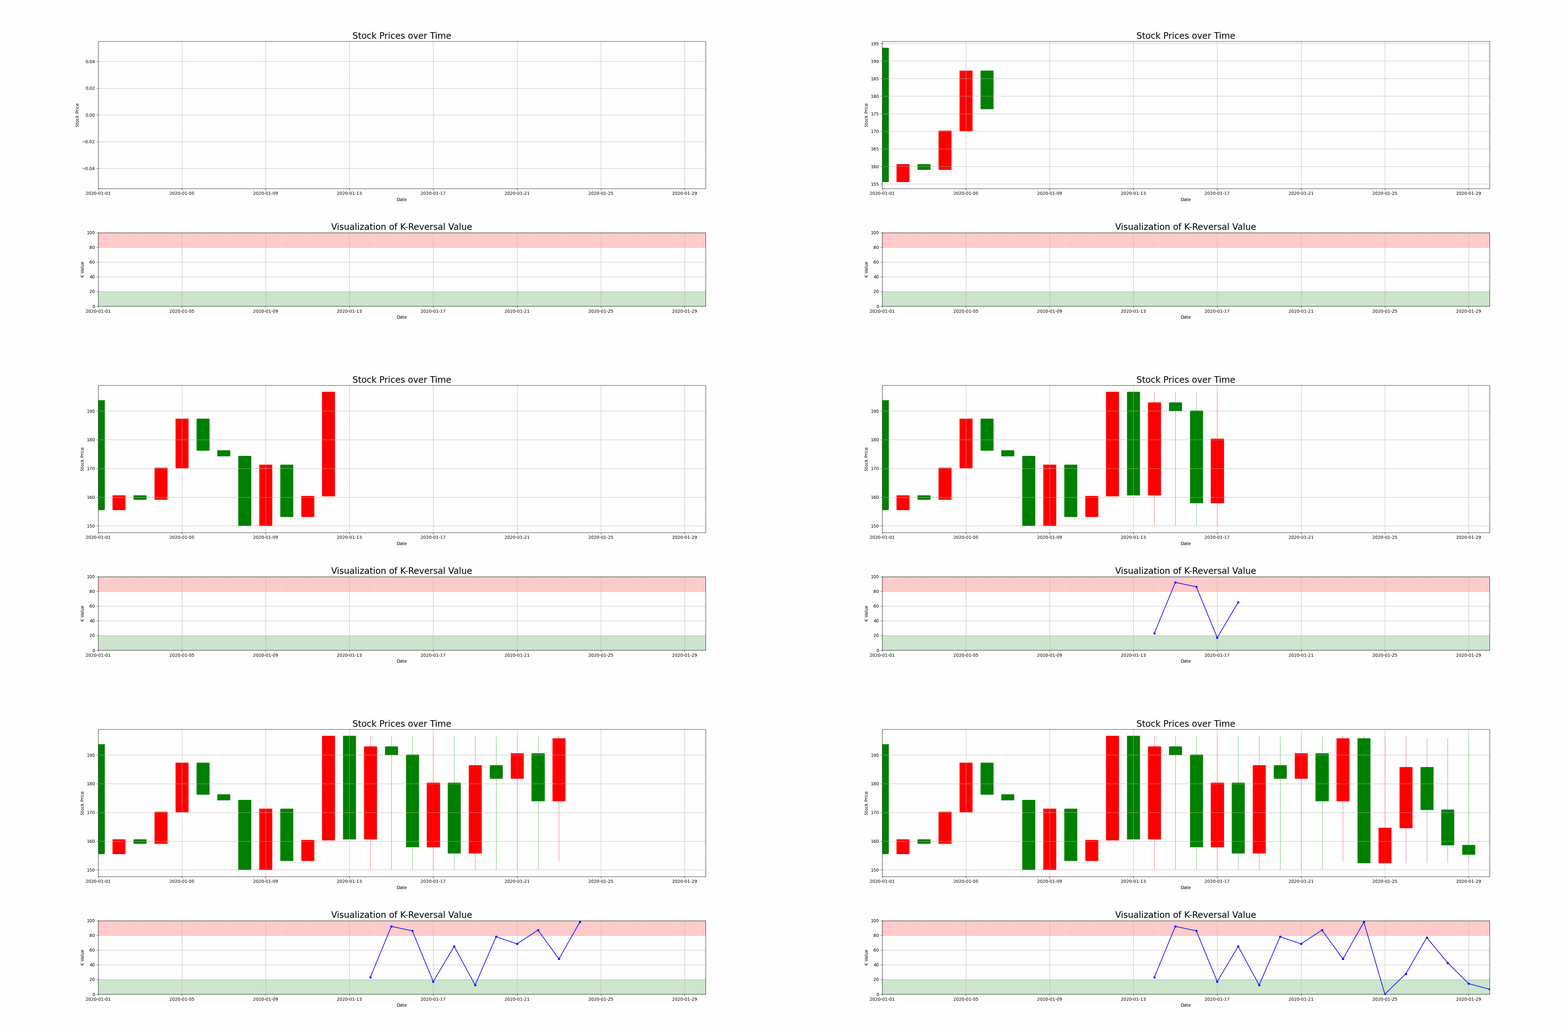
Figure. 1: Visual Representation of Simulated Stock Prices and K-Reversal Indicator (N=14): The candlestick chart at the top tracks the fluctuation of stock prices. The graph below provides the K-Reversal Indicator, illustrating periods when the stock is potentially oversold and overbought.
For the purpose of stock price analysis, libraries such as pandas for data manipulation and matplotlib for data visualization are instrumental. We can further leverage libraries such as pandas_datareader or platforms like Yahoo Finance to retrieve historical stock data seamlessly.
The process involves specifying the stock ticker, and the desired time frame, and the library handles the rest, returning the data in a structured format, ready for analysis. To acquire stock data, the yf.download() method is leveraged:
					ticker = "ASML.AS"
df = yf.download(ticker, start="2020-01-01", end="2023-12-26")
df['Date'] = df.index
Using pandas, the K-Reversal indicator calculation can easily be performed as follows:
					def calculate_k_reversal(df, n=14):
    highs = df['High'].rolling(n).max()
    lows = df['Low'].rolling(n).min()
    k_values = 100 * (df['Close'] - lows) / (highs - lows)
    return k_values

k_values = calculate_k_reversal(df)
Upon having the K-Reversal values, it’s imperative to identify the buy and sell signals:
					buy_signals_k = k_values[k_values < 20]
sell_signals_k = k_values[k_values > 80]
buy_signals_price = df[df['Close'] < df['Close'].rolling(20).min()]['Close']
sell_signals_price = df[df['Close'] > df['Close'].rolling(20).max()]['Close']
Keep in mind that the thresholds for K-Reversal to pinpoint buy and sell signals are customizable. You have the flexibility to fine-tune or backtest these values, optimizing them to minimize false positives and enhance accuracy.
Using the matplotlib library, we can create intuitive visualizations for our analysis. For instance, the stock price with buy and sell signals is depicted as:
					fig, ax = plt.subplots(figsize=(30, 5))
ax.plot(df['Date'], df['Close'], color='black', label='ASML Stock Price')
...
plt.show()
And the K-Reversal indicator visualization is represented by:
					fig, ax = plt.subplots(figsize=(30,5))
ax.plot(df['Date'], k_values, color='blue', label='K Reversal')
...
plt.show()
While the sections above detail individual steps of the analysis, integrating them provides an end-to-end solution for stock price evaluation:

Newsletter