Use the Fama-French 5-Factor Model plus momentum to identify undervalued stocks, analyze alpha, and measure return contributions in Python
Markets aren’t always efficient. Stocks can be mispriced for extended periods. This creates opportunities for traders who know where to look.
Factor models give us insights around these inefficiencies. The Fama-French 5-Factor Model breaks stock returns into key drivers — market risk, size, value, profitability, and investment. Adding momentum can improve the model.
But even with these factors, some returns remain unexplained. That’s alpha — the portion of returns that can’t be justified by known risk factors.
Entreprenerdly offers an automated tool connected to real-time data that implements factor exposure analysis:
This article walks you through a factor-based model to test for mispricing. You’ll:
- Download and clean Fama-French factor data
- Merge it with stock price data
- Run rolling factor regressions to explain excess returns
- Identify mispricing signals using statistical tests
- Track rolling factor exposures over time
End-to-end Google Colab Implementation provided below.
1. The 5-Factor Model (Plus Momentum)
Stock returns are influenced by multiple factors beyond overall market movements.
The Fama-French 5-Factor Model expands on traditional asset pricing by incorporating five key drivers of return:

Where:
1.1 Market Risk (Rm−Rf)
This factor represents the excess return of the market over the risk-free rate. It is calculated as:

A stock with a high beta (>1) is more volatile than the market, while a low beta (<1) indicates lower sensitivity to market movements.
1.2 Size Factor (SMB: Small Minus Big)
This factor captures the size premium, which suggests that small-cap stocks tend to outperform large-cap stocks over time.
- Each month, all stocks are sorted into small-cap (S) and large-cap (B) groups based on market capitalization.
- Within each group, stocks are further split into value, neutral, and growth segments using book-to-market ratios.
- SMB is then calculated as the average return of small-cap portfolios minus the average return of large-cap portfolios:

where V, N, and G represent value, neutral, and growth portfolios.
A stock which has a positive SMB beta, means that behaves like a small-cap stock, while a negative SMB beta suggests large-cap characteristics.
1.3 Value Factor (HML: High Minus Low)
The value premium suggests that cheap stocks (high book-to-market) tend to outperform expensive stocks (low book-to-market).
- Stocks are ranked by book-to-market ratio (B/M) and divided into high (H), neutral (N), and low (L) groups.
- HML is the average return of value stocks minus the average return of growth stocks:
A positive HML beta suggests a stock behaves like a value stock, while a negative HML beta indicates growth characteristics.
1.4 Profitability Factor (RMW: Robust Minus Weak)
Firms with high profitability tend to outperform firms with low profitability. The RMW factor measures this effect.
- Stocks are ranked by operating profitability (revenues minus cost of goods sold, interest, and SG&A expenses, divided by total equity).
- The return of high-profitability stocks is compared to low-profitability stocks:
where R (Robust) represents firms with high profitability and W (Weak) represents low-profitability firms.
A high RMW beta suggests exposure to profitable firms, while a low or negative beta indicates sensitivity to low-profitability stocks.
1.5. Investment Factor (CMA: Conservative Minus Aggressive)
Firms that invest aggressively tend to underperform firms with conservative investment strategies. The CMA factor captures this effect.
- Stocks are ranked by their asset growth rate (change in total assets over total assets).
- The return of firms with low investment (conservative) is compared to high-investment firms (aggressive):

where C (Conservative) represents firms with low investment, and A (Aggressive) represents firms with high investment.
A high CMA beta suggests the stock aligns with firms that invest conservatively, while a low or negative beta indicates aggressive reinvestment behavior by the stock.
1.6. Momentum Factor (MOM: Winners Minus Losers)
Momentum suggests that stocks that have performed well in the past tend to keep outperforming in the short term.
- Stocks are ranked by their returns over the past 12 months (excluding the most recent month).
- The return of past winners (top 30%) is compared to the return of past losers (bottom 30%):
This factor accounts for trend persistence in stock prices, which traditional valuation-based factors do not capture.
A positive MOM beta indicates momentum exposure — stocks that trend upward. A negative beta suggests mean-reverting behavior.
Why all of this matters
Each factor isolates a unique driver of stock returns. If a stock’s performance aligns with these factors, it suggests exposure to known risks.
If it consistently outperforms beyond factor expectations, it may indicate alpha — potential mispricing in the framework we’ll present.
Next, we’ll download real-world factor data to test the model.
2. Downloading the Factor & Stock Price Data
2.1 Fama-French 5-factor Data
The Fama-French 5-factor data is hosted on Dartmouth’s Ken French Data Library. The dataset contains daily (and/or monthly/weekly) factor returns.
We download this data programmatically with the following Python code:
import requests
import zipfile
import io
import re
import pandas as pd
import yfinance as yf
class FamaFrenchDownloader:
"""Downloads and processes Fama-French 5-factor data (daily)."""
FF5_URL = "https://mba.tuck.dartmouth.edu/pages/faculty/ken.french/ftp/F-F_Research_Data_5_Factors_2x3_daily_CSV.zip"
@staticmethod
def download_ff5():
"""Fetches and extracts F-F 5-Factor data from the web."""
response = requests.get(FamaFrenchDownloader.FF5_URL)
with zipfile.ZipFile(io.BytesIO(response.content)) as z:
file_name = z.namelist()[0]
with z.open(file_name) as f:
return f.read().decode("utf-8").splitlines()
@staticmethod
def parse_ff5_data():
"""Extracts and cleans F-F 5-Factor data."""
lines = FamaFrenchDownloader.download_ff5()
# Keep only data lines (starting with 8-digit dates)
data_lines = [line for line in lines if re.match(r'^\s*\d{8}', line)]
# Read into DataFrame
df = pd.read_csv(io.StringIO("\n".join(data_lines)), sep=r"\s*,\s*", header=None, engine="python")
# Assign column names
df.columns = ["Date", "MKT_RF", "SMB", "HML", "RMW", "CMA", "RF"]
# Convert date column
df["Date"] = pd.to_datetime(df["Date"], format="%Y%m%d", errors="coerce")
# Convert numeric columns
df.iloc[:, 1:] = df.iloc[:, 1:].apply(pd.to_numeric, errors="coerce")
return df
# Usage (Fixed)
ff5_df = FamaFrenchDownloader.parse_ff5_data()
ff5_df

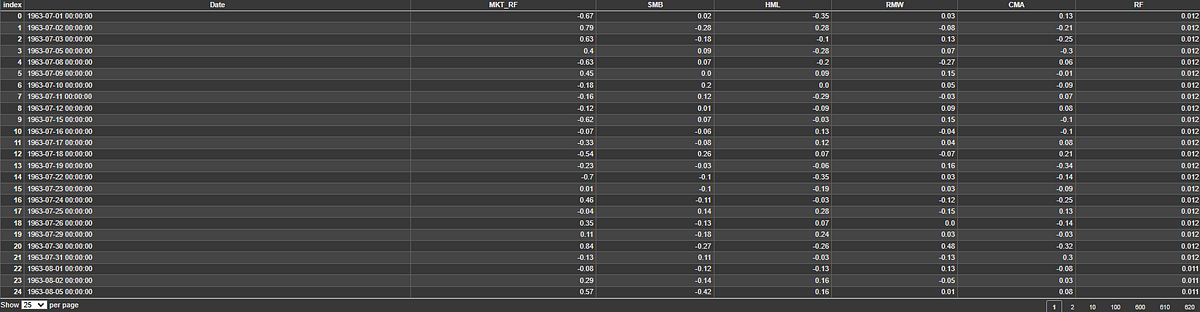
Figure 1: Fama-French factor data, including market risk (MKT_RF), size (SMB), value (HML), profitability (RMW), investment (CMA), and risk-free rate (RF).
2.2 The Momentum Factor
Momentum is not included in the standard Fama-French dataset but is available separately. We can fetch and clean it similarly:
Newsletter