Back To Top

August 23, 2024

Calculate The Fair Value of Stocks Using DCF with Public Data

Estimating Instrinsic Value Programmatically with Yahoo Finance

Calculating the fair value of stocks is an essential part of an investor’s due diligence toolkit. The Discounted Cash Flow model allows analysts to estimate a company’s intrinsic value by discounting future cash flow projections using the current cost of capital.

In this guide, we will break down the DCF model into clear steps using publicly available data for various tickers. We will show you how to project future cash flows, discount them to the present, and calculate the terminal value.

To help you apply these steps, we’ve prepared a Google Colab notebook. This will allow you to implement the model yourself and adjust the key assumptions as needed. For those who prefer a ready-made solution, Entreprenerdly’s advanced valuation tool provides a comprehensive analysis. 

Google Colab Demo Fair Value Estimation AVIF

This article is structured as follows:

  • Key Steps in DCF Model
  • Accessing Public Financial Data
    • Cash Flows
    • Income Statement
    • Balance Sheet
  • Future Growth Estimates from Analysts
  • Calculate Cost of Equity
  • Calculate Cost of Debt
  • Effective Tax Rate and WACC
  • Discounting Cash Flows and Terminal Value
  • Intrinsic Value Per Share
  • Margin of Safety
  • Sensitivity Analysis – WACC, Growth Rates and Fair Values

1. The Discounted Cash Flow model

DCF model estimates the present value of a company by projecting future free cash flows and discounting them back to the present using a discount rate:

DCF Formula to Calculate Fair Value of Stocks

Here are FCFt are the future projected cash flows, r is the discount rate, TV is the terminal value. We’ll discuss each in detail.

Step 1. Project Future Free Cash Flows:

The first step in the DCF model is to project the company’s future free cash flows. 

These cash flows represent the amount of cash a company generates after accounting for capital expenditures:

Formula for Free Cash Flow to Calculate Fair Value of Stocks

To project FCF, start with the most recent FCF and apply a growth rate, g:

Project Future Cash Flows Formula to Calculate Fair Value of Stocks

This growth rate is based on the company’s earnings projections, industry averages, or analyst estimates.

Cash flows are forecasted until a stable growth period is expected, often 5 to 10 years into the future.

Step 2. Discount Cash Flows:

The next step is to discount the future FCFs to their present value using a discount rate, usually derived from the ‘Weighted Average Cost of Capital’ (WACC).

Discount Future Cash Flows Formula in DCF model

WACC reflects the company’s cost of equity and debt, adjusted for tax effects:

Weighted Cost of Capital Accounting For Effective Tax Rate

By discounting future cash flows, you determine what those future dollars are worth today.

Please note that calculting the cost of equity and the cost of debt involves its own process which we will discuss in the implementation below. 

Step 3. Calculate Terminal Value:

Next, estimate the terminal value, which accounts for all future cash flows beyond the forecast period.

This can be calculated using the Gordon Growth Model. In this model, you need to assume  a constant ‘perpetual’ growth rate that reflects long-term expectations.

Terminal Value Formula with Perpetual Growth Rate for Cash Flows

One can set the perpetual growth rate at 2% or 3%, which aligns with long-term economic growth or inflation expectations.

Step 4. Calculate Enterprise Value

With the discounted FCFs and terminal value in hand, you can calculate the enterprise value of the company.

This is done by summing the present value of the projected FCFs and the discounted terminal value.

The enterprise value represents the total value of the company’s operations in today’s terms.

Enterprise Value Formula

Step 5. Calculate Net Debt:

To move from enterprise value to equity value, subtract net debt.

Net debt is simply the company’s total debt minus its cash and cash equivalents.:

Net Debt Formula

Next step is to isolate the value that belongs to shareholders:

Equity Value Formula

Step 6. Calculate Intrinsic Value per Share

Finally, divide the equity value by the number of shares outstanding to calculate the intrinsic value per share.

This value represents what each share of the company is worth based on the DCF model.

Comparing this intrinsic value to the current market price will help you determine whether the stock is undervalued or overvalued.

Intrinsic Value Per Share Formula

2. Programatic Implementation

In this section, we’ll set up the code for pulling in the data, and calculating everything needed for the DCF model.

Building the DCF model programmatically makes the process more efficient and flexible. It allows us to easily tweak assumptions and explore different scenarios.

2.1 Libraries and Ticker

First, ensure these libraries are installed:

  • yfinance: For retrieving financial data from Yahoo Finance.
  • numpy and pandas: For data manipulation and numerical operations.
  • requests and BeautifulSoup: For scraping additional financial data from web sources (e.g. analyst’ growth rates).
				
					import yfinance as yf
import numpy as np
import pandas as pd
import requests
from bs4 import BeautifulSoup
from datetime import datetime, timedelta
import warnings
warnings.filterwarnings("ignore")


Then, we initialize the ticker object for the stock we’re analyzing. For this example, we’ll use NVIDIA (ticker: NVDA), but you can replace it with any other stock ticker.

				
					# Define the ticker symbol
ticker_symbol = "NVDA"  # You can change this to any ticker you want to analyze

# Initialize the ticker object used
# For more information about this object, refer to the library's official documentation: https://github.com/ranaroussi/yfinance
ticker = yf.Ticker(ticker_symbol)


2.2 Cash Flow

Next, we retrieve the company’s cash flow statement. Free Cash Flows are stated directly. If not, you can deduce them by deducing capital expenses from operating cash flows.

				
					# Fetch Cash Flow Statement for Free Cashflow
cash_flow = ticker.quarterly_cashflow

# Display all of the available Cash Flow Data
cash_flow
				
			
Cash flow Table

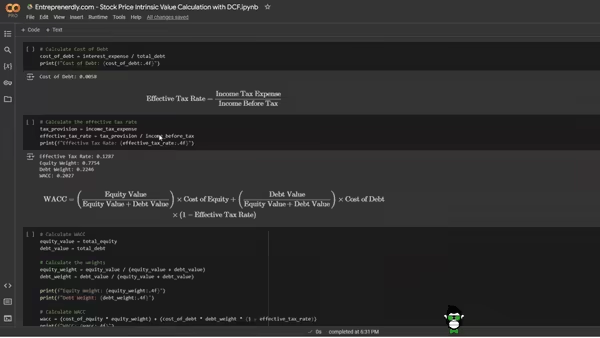
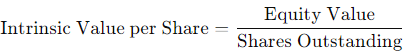
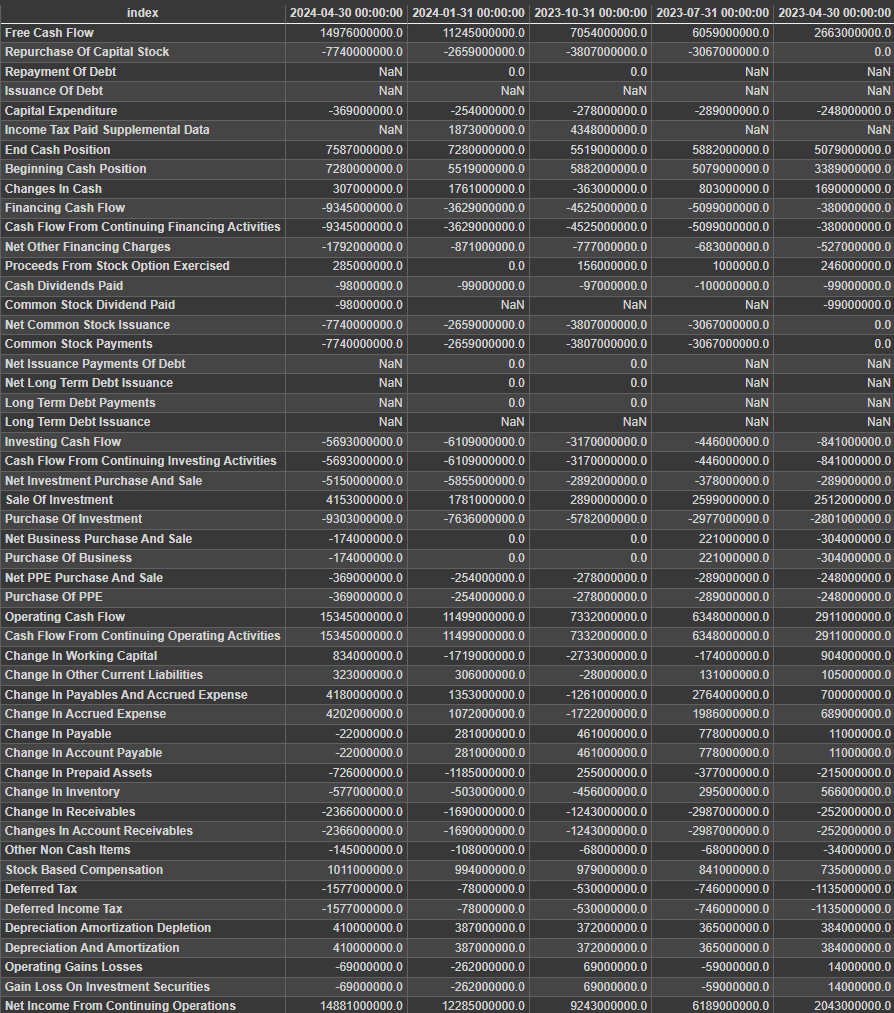
Figure. 1: Cash Flow Statement: Quarterly Cash Flow data for NVDA.

We’ll fetch the latest four quarterly cash flow statements, focusing on the “Free Cash Flow” line item. 

				
					# Display the Free Cash Flow for the last four available quarters
print("Free Cash Flow (Individual Quarters):")
print(cash_flow.loc['Free Cash Flow'].iloc[0:4])


					Free Cash Flow (Individual Quarters):
2024-04-30    14976000000.0
2024-01-31    11245000000.0
2023-10-31     7054000000.0
2023-07-31     6059000000.0


Then, we sum the quarters, which gives us the trailing twelve months (TTM) Free Cash Flow:

Formula for Annual Free Cash Flows Trailing Twelve Month
				
					# Aggregate the Free Cash Flow for the last four quarters (sum the values)
annual_free_cash_flow = cash_flow.loc['Free Cash Flow'].iloc[0:4].sum()

print("Annual TTM Free Cash Flow:")
print(annual_free_cash_flow)


					Annual TTM Free Cash Flow:
39334000000.0


2.3 Income Statement

The income statement offers a view into the company’s profitability –  Interest Expense, Pretax Income, and Tax Provision are among the metrics we’ll use.

These are necessary for calculating the Cost of Debt and the Effective Tax Rate.

				
					# Fetch Income Statement for the Last Four Quarters
income_statement = ticker.quarterly_financials

income_statement
				
			
Income Statement Table

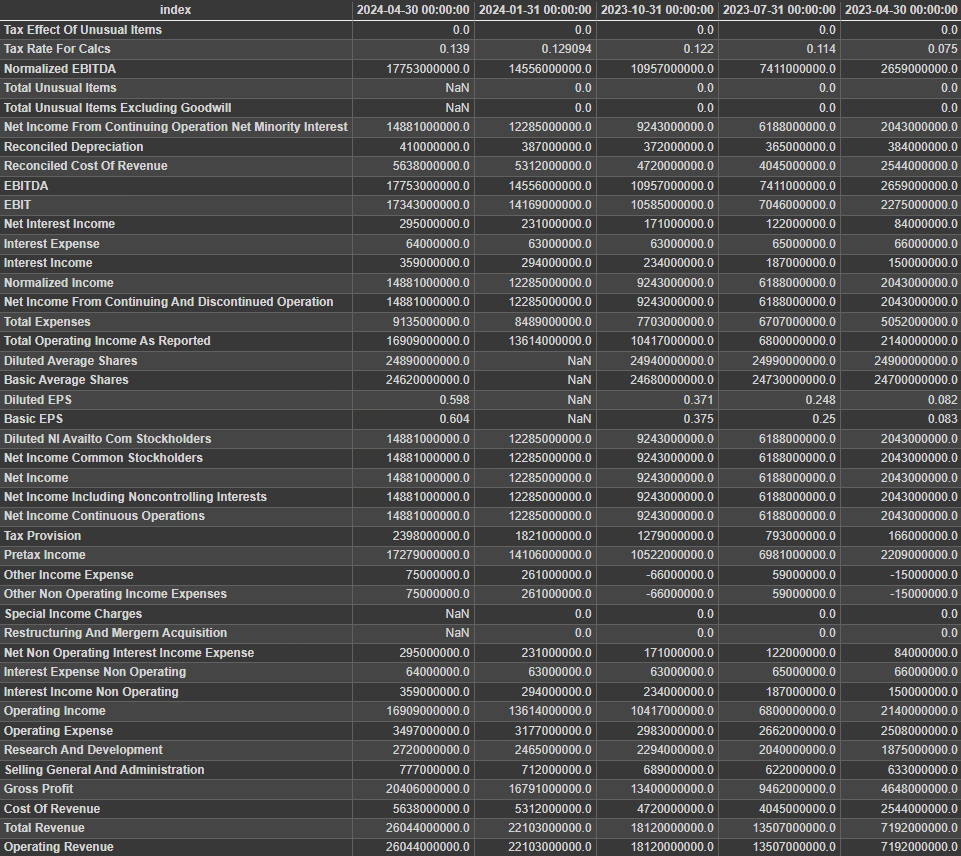
Figure. 2: Income Statement: Key Income Statement figures including Interest Expense and Pretax Income, essential for calculating the Cost of Debt and Effective Tax Rate.

We’ll aggregate these figures from the last four quarters, similarly to the free cash flows.

				
					# Display the individual items for the last available quarters
print("Income Statement (Individual Quarters):")
income_statement.loc[['Interest Expense', 'Pretax Income', 'Tax Provision']]
				
			
Income-Statement-Interest-Expense-Pretax-Tax-Provision

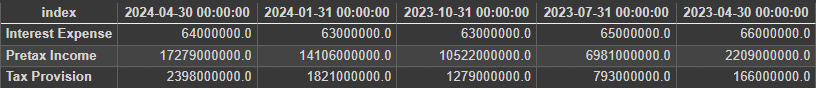
Figure. 1: A dancer's movement captured through the Ego-Exo4D lens, accompanied by expert commentary, showcases the dataset's depth in analyzing the finesse of human skill.

Interest expense will help us determine the company’s cost of debt, which is one of the components of WACC.

Note: 

If the Interest Expense is not directly stated in the financial data, you can estimate it by retrieving the average interest rate on the company’s debt. To do this, you can:

Check the Company’s Filings: Review the company’s most recent annual or quarterly reports (10-K or 10-Q) for details on interest rates associated with outstanding loans or bonds.

  • Use Market Data: Look up the company’s credit ratings from agencies like Moody’s, S&P, or Fitch, and refer to comparable bond yields in the market.
  • Estimate from Past Data: Divide the previously reported Interest Expense by the total debt from the same period to get an implied average interest rate.
  • Industry Averages: Consider using industry average interest rates if detailed company data isn’t available. These averages can often be found in financial databases or industry reports.

Once you know the interest rate, multiply the total debt by this interest rate to get the total Interest Expense.

Formula for Trailing Twelve Month Interest Expense

Income before tax and income tax expense are used to calculate the effective tax rate, which adjusts the cost of debt in the DCF model:

Income Before Tax Trailing Twelve Month Formula
Formula for Income Tax Expense Trailing Twelve Months

Adjusting the cost of debt for taxes is important because interest payments on debt are tax-deductible. This means the actual cost of borrowing is lower than the nominal interest rate.

Therefore, by applying the effective tax rate, you account for this tax shield, which reduces the company’s overall cost of debt.

				
					# Aggregate the values for the last four quarters
interest_expense = income_statement.loc['Interest Expense'].iloc[0:4].sum()
income_before_tax = income_statement.loc['Pretax Income'].iloc[0:4].sum()
income_tax_expense = income_statement.loc['Tax Provision'].iloc[0:4].sum()

# Output the aggregated results
print("\nAggregated Income Statement (Last 4 Quarters Combined):")
print(f"Interest Expense: {interest_expense:.2f}")
print(f"Income Before Tax: {income_before_tax:.2f}")
print(f"Income Tax Expense: {income_tax_expense:.2f}\n")


					Aggregated Income Statement (Last 4 Quarters Combined):
Interest Expense: 255000000.00
Income Before Tax: 48888000000.00
Income Tax Expense: 6291000000.00


2.4 Balance Sheet

The balance sheet is needed to determine the company’s capital structure. Specifically its total debt, cash, and total equity.

These components help calculate Net Debt, which is used to transition from Enterprise Value to Equity Value. 

				
					# Fetch Balance Sheet for the Last Four Quarters
balance_sheet = ticker.quarterly_balance_sheet

balance_sheet
				
			
Balance-Sheet-Table-AVIF

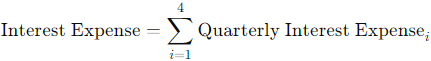
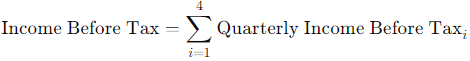
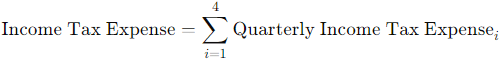
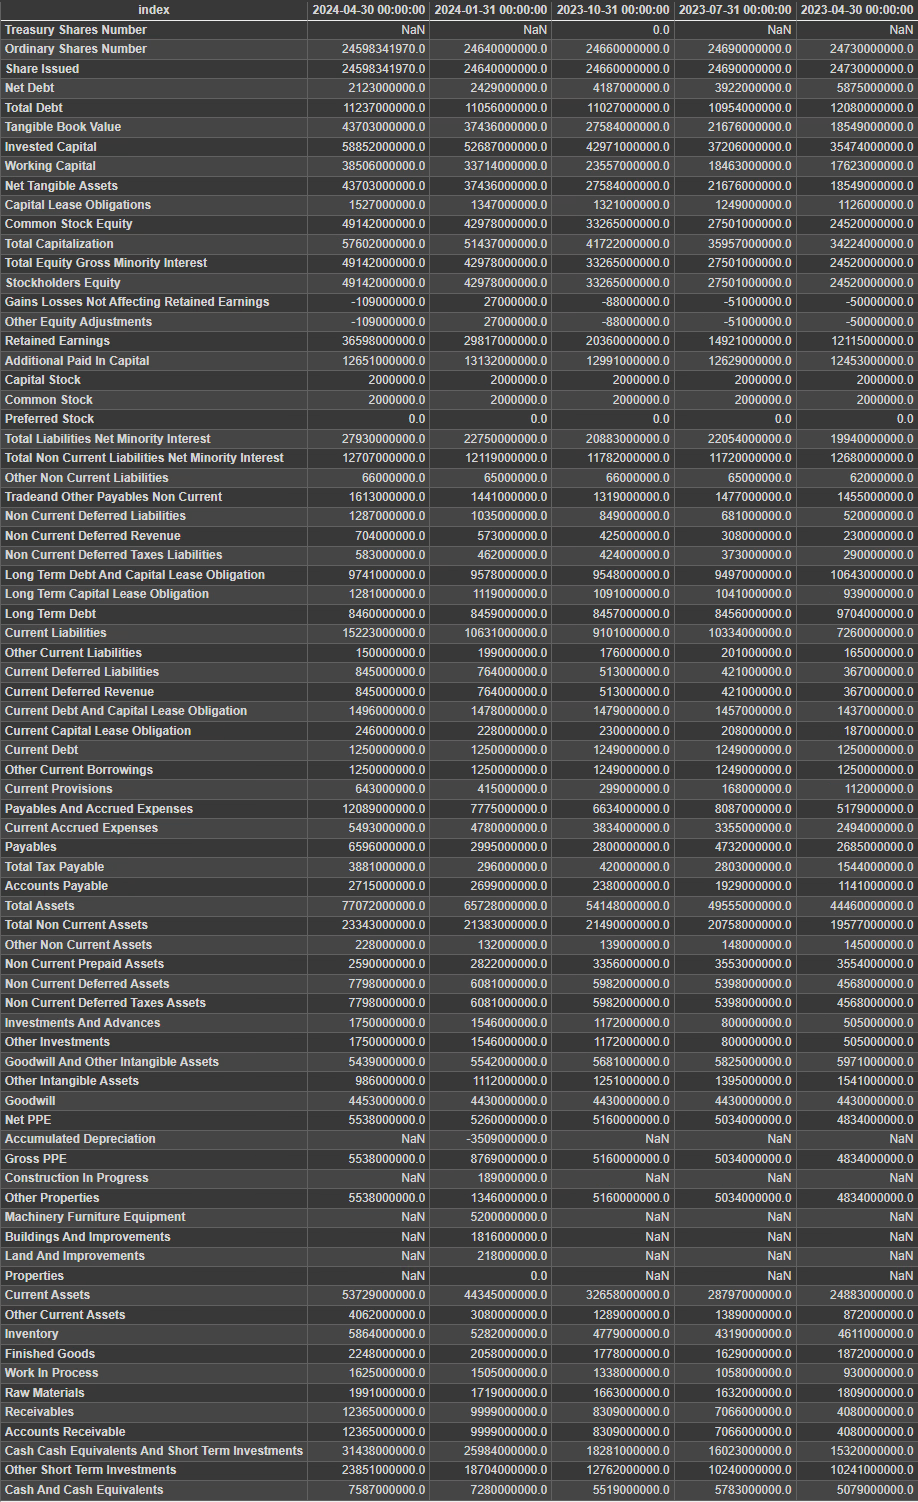
Figure. 3: Balance Sheet: Quarterly Balance Sheet data showing Total Debt, Cash and Cash Equivalents, and Stockholders' Equity—crucial for calculating Net Debt and Equity Value.

In the balance sheet statement, identify ‘Total Debt’, ‘ Cash and Cash Equivalents’, and ‘Stockholder Equity’:

				
					# Display the individual items for the last available quarters
print("Balance Sheet (Individual Quarters):")
#balance_sheet.loc[['Current Debt', 'Long Term Debt', 'Cash And Cash Equivalents', 'Stockholders Equity']]
balance_sheet.loc[['Total Debt', 'Cash And Cash Equivalents', 'Stockholders Equity']]


Balance-Sheet-Table-Total-Debt-Cash-and-Equity

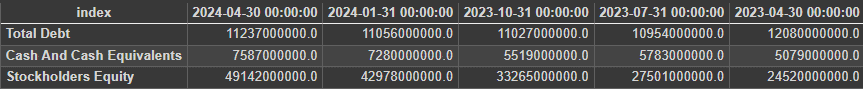
Figure. 4: Summary Table of Key Financials: Summary of Total Debt, Cash and Cash Equivalents, and Stockholders' Equity over the last four quarters.

Total Debt is part of the Net Debt calculation, which is needed to figure out the company’s Equity Value.

Annual Total Debt Trailing Twelve Formula Formula

Cash and Equivalents are deducted from Total Debt to find Net Debt. This Net Debt is used to determine the company’s Equity Value, which then helps us calculate the Intrinsic Value per Share.

Formula for Trailing Twelve Formula for Annual Cash

Total Equity is needed to calculate the weights of debt and equity, which are part of the WACC.

Trailing Twelve Month Total Equity Formula

Finally, we also retrieve shares outstanding. Shares outstanding refer to the total number of a company’s shares that are currently held by all its shareholders, including shares held by institutional investors and company insiders.

				
					# Aggregate the values for the last four quarters
total_debt = balance_sheet.loc['Total Debt'].iloc[0:4].sum()
cash_and_equivalents = balance_sheet.loc['Cash And Cash Equivalents'].iloc[0:4].sum()
total_equity = balance_sheet.loc['Stockholders Equity'].iloc[0:4].sum()

# Retrieve the number of shares outstanding. We'll divide the total value of the firm by this value to find the intrinsic value per share
shares_outstanding = ticker.info['sharesOutstanding']

# Output the aggregated results
print("\nAggregated Balance Sheet (Last 4 Quarters Combined):")
print(f"Total Debt: {total_debt:.2f}")
print(f"Cash and Cash Equivalents: {cash_and_equivalents:.2f}")
print(f"Total Equity: {total_equity:.2f}")
print(f"Shares Outstanding: {shares_outstanding}\n")


					Aggregated Balance Sheet (Last 4 Quarters Combined):
Total Debt: 44274000000.00
Cash and Cash Equivalents: 26169000000.00
Total Equity: 152886000000.00
Shares Outstanding: 24598300672


More articles worth reading:

Top 36 Moving Average Methods For Stock Prices in Python

Fundamental Techniques, Adaptive and Dynamic, Advanced Weighting and From Niche to Noteworthy
Prev Post

Identifying a Volatility Squeeze Algorithmically

post-bars
Mail Icon

Newsletter

Get Every Weekly Update & Insights

[mc4wp_form id=]

Leave a Comment