Experience the Future of Intelligent Investing Today
Back To Top
Experience the Future of Intelligent Investing Today

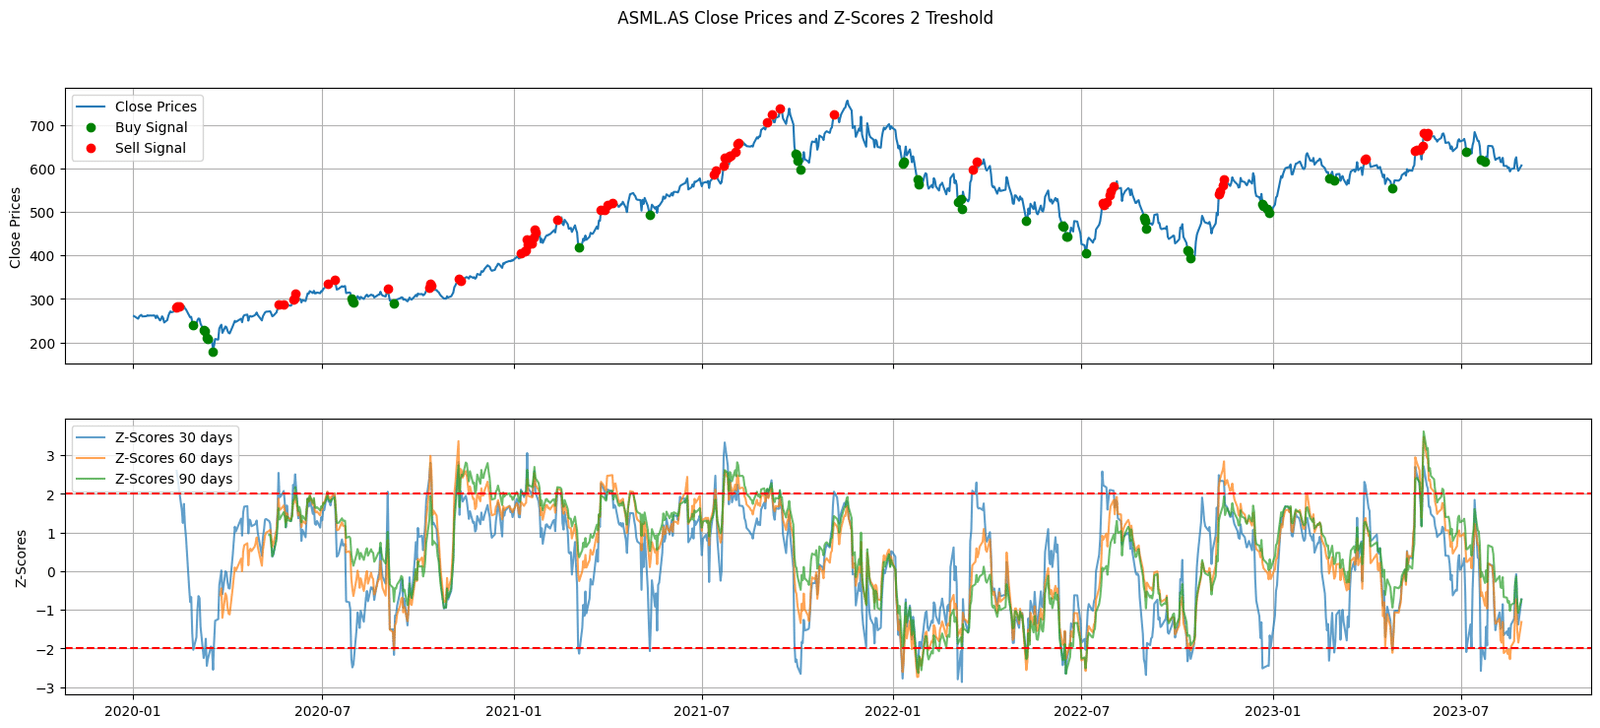
Figure 1. Evolution of ASML.AS stock prices juxtaposed with rolling Z-Scores over 30, 60, and 90-day periods. Green and red markers highlight potential buy and sell points respectively, based on Z-Score thresholds.
Enter the rolling z-score. A statistical measure that can provide traders with invaluable insights into the relative strength and positioning of a stock.
Whether it’s forecasting future prices, analyzing market trends, or simply gauging the volatility of a particular stock, data-driven insights have transformed the way traders approach the stock market.
Imagine being able to identify when a stock might be overbought or oversold simply by looking at its past prices and volatility. This is precisely what the rolling Z-Score can offer, and in this article, we’re going to deep dive into how Python — a powerhouse in data analysis — can be harnessed to calculate and interpret Z-Scores for stock trading.


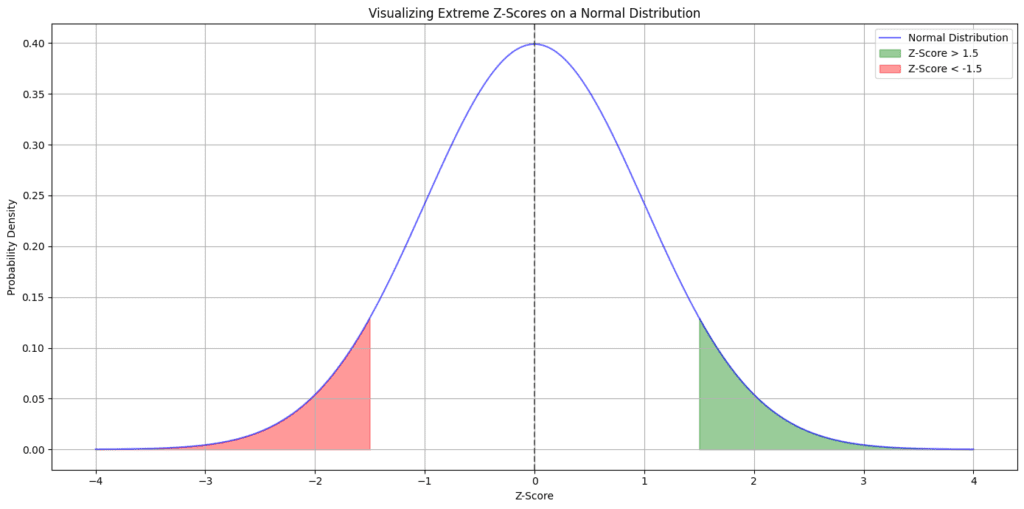
Figure. 2: Highlighting the regions of a normal distribution where Z-Scores exceed 1.5 or fall below -1.5. This visualization underscores the statistical significance of extreme stock price movements, guiding traders towards potential outlier opportunities and signal for stock price reversals
Z-Scores provide a measure of how far away a particular data point is from the mean, in terms of standard deviations. In trading, this can help us understand if a stock’s current price is statistically “normal” or if it’s an outlier.
Imagine a bell curve representing a normal distribution. Most stock prices (assuming they are normally distributed, which is a big assumption and often not the case in real-life trading) will lie near the middle. Those that lie in the tails, beyond a certain Z-Score (like 1.5 or -1.5), are the ones that pique our interest.

Equation. 1: The Z-Score Formula: A mathematical representation detailing how deviations from the mean are standardized using the population’s standard deviation. This equation is pivotal for traders aiming to quantify stock price movements relative to historical data.
Where:
By analyzing stock prices through the lens of Z-Scores, traders can identify potential buy/sell opportunities. A Z-Score significantly higher than 1.5 might indicate that the stock is overpriced compared to its historical average, whereas a Z-Score significantly lower than -1.5 might indicate the opposite.
Before diving deep, it’s essential to arm ourselves with the right tools. By importing relevant Python libraries like yfinance for fetching stock data and matplotlib for visualization, we ensure a smooth start.
					import yfinance as yf
import pandas as pd
import matplotlib.pyplot as plt
To gauge stock anomalies, we zero in on a particular stock — for demonstration purposes, we’ve picked “ASML.AS”. We then pull historical stock data using the yfinance library.
					tickerSymbol = "ASML.AS"
tickerData = yf.Ticker(tickerSymbol)
tickerDf = tickerData.history(period='1d', start='2020-1-1', end='2023-12-25')
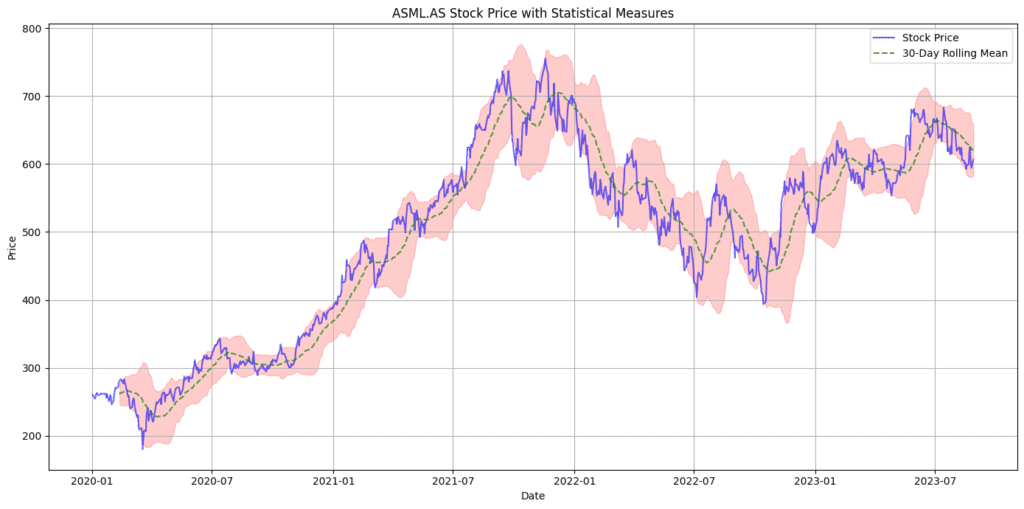
At the core of our analysis is the Z-Score formula, which helps gauge how “off” a stock price is relative to its history. We compute this for multiple rolling periods to capture short-term and long-term anomalies..
					rolling_mean = close_prices.rolling(window=period).mean()
rolling_std = close_prices.rolling(window=period).std()
z_scores = (close_prices - rolling_mean) / rolling_std

Newsletter