The 11 Greatest Trades in Stock Market History
Figure 1. Dow Jones Industrial Average from 1923 to 1933. The 1929 peak and subsequent crash mark the period of Jesse Livermore’s historic short trade. Source: www.taprofessional.de
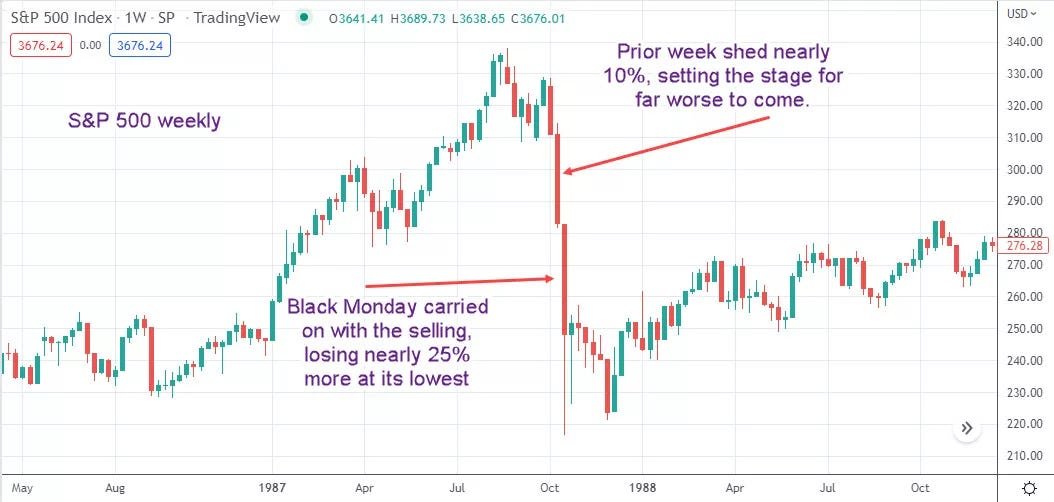
Figure 2. 1987 Black Monday crash, where stocks lost nearly 25% in a single session. Source: Investopedia.com.
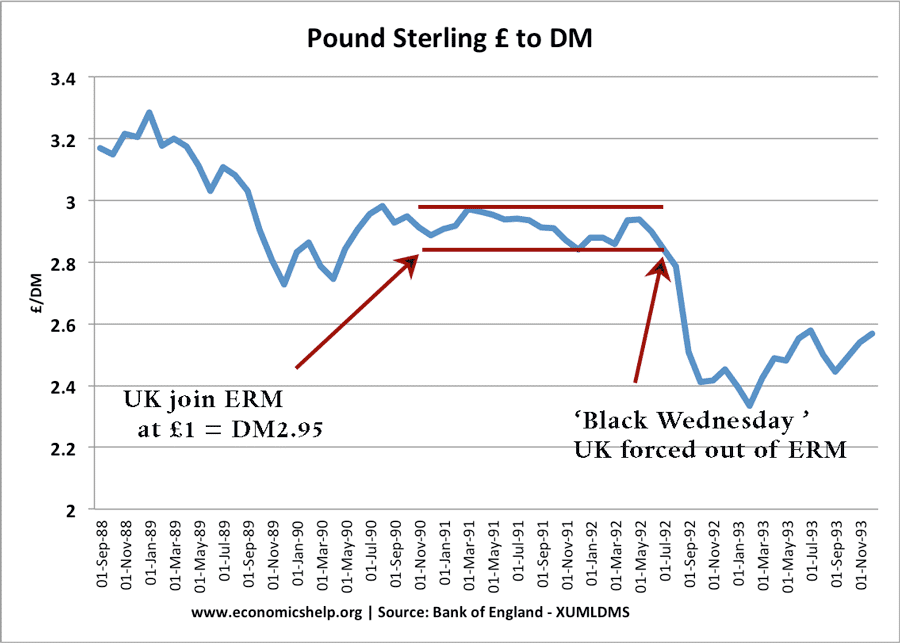
Figure 3. Pound sterling vs. Deutsche Mark, 1988–1993. The chart highlights the collapse of the pound on “Black Wednesday” as the UK exited the ERM, Source: Bank of England / economicshelp.org.
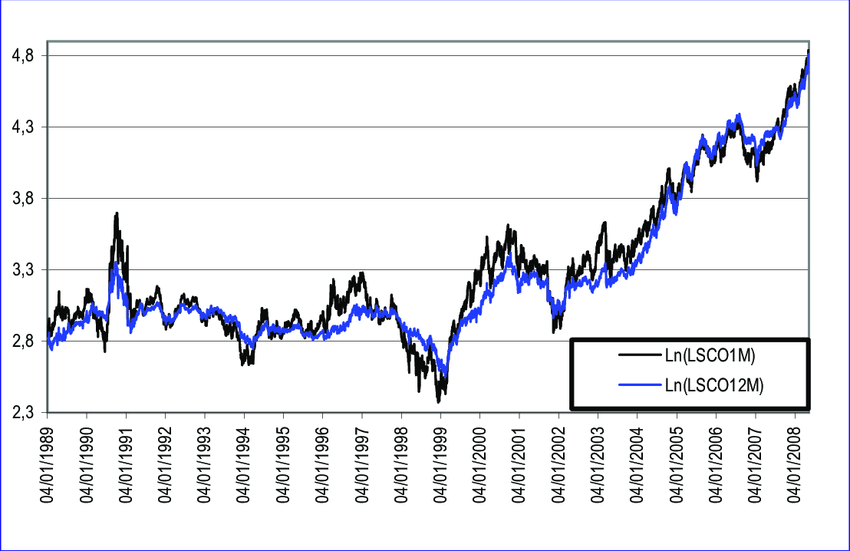
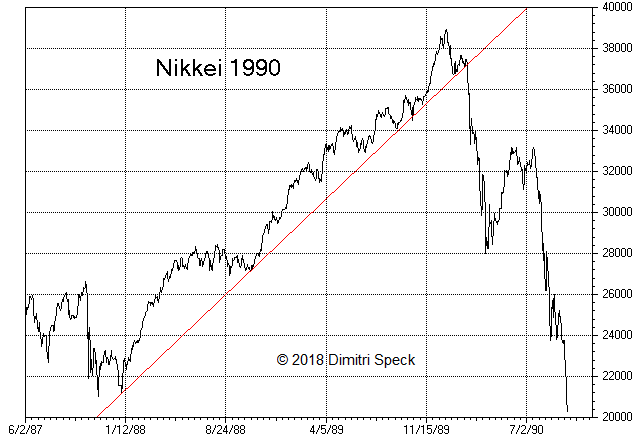
Figure 4. Left: Crude oil futures prices spiked in 1990 as the Gulf War began. Right: The Nikkei peaked in late 1989 and crashed through 1990 as Japan’s asset bubble burst. Sources: ResearchGate, Investing.com.
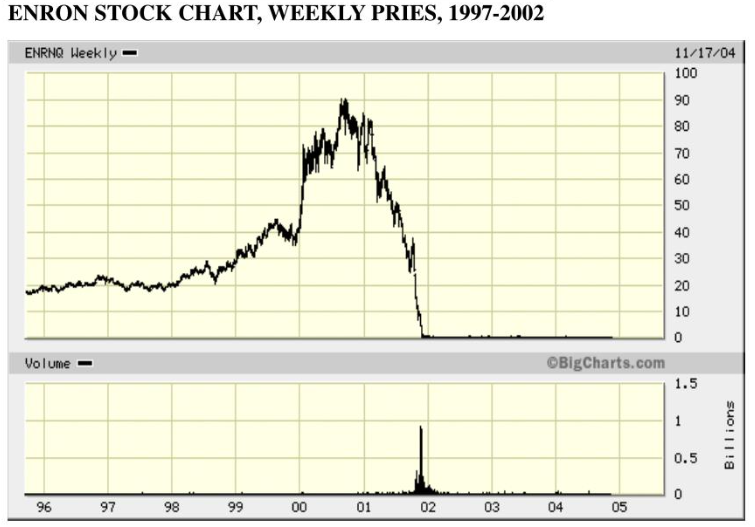
Figure 5. Enron’s weekly stock price from 1997 to 2002. It peaked near $90 in 2000 before collapsing to zero as the company’s fraud was exposed. Source: slideserve.com.
Figure 6. Subprime mortgage originations exploded from 2003 to 2006, with securitized loans reaching record highs and accounting for nearly a quarter of all U.S. mortgages. Source: Inside Mortgage Finance.
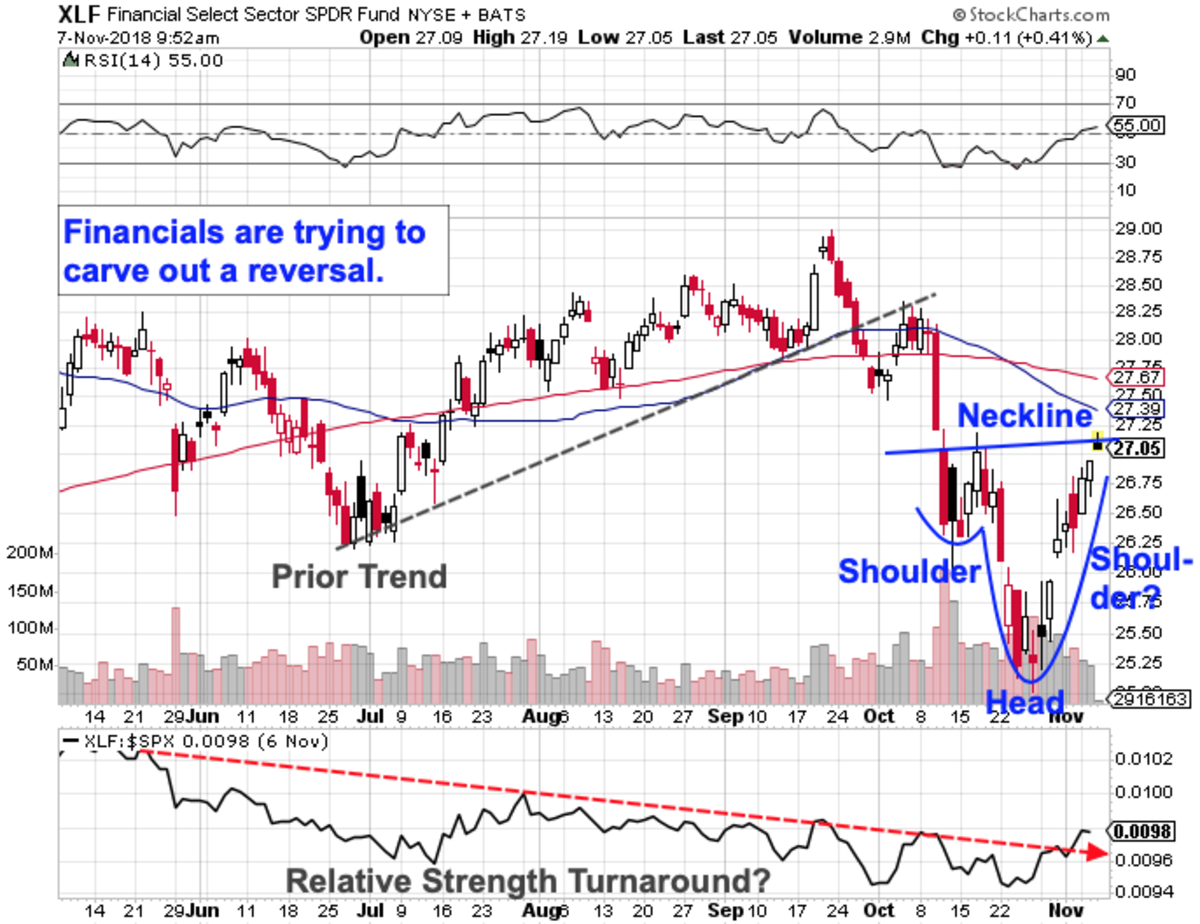
Figure 7. Financial sector ETF (XLF) forming a reversal pattern after the 2008–09 crash. Source: TheStreet.
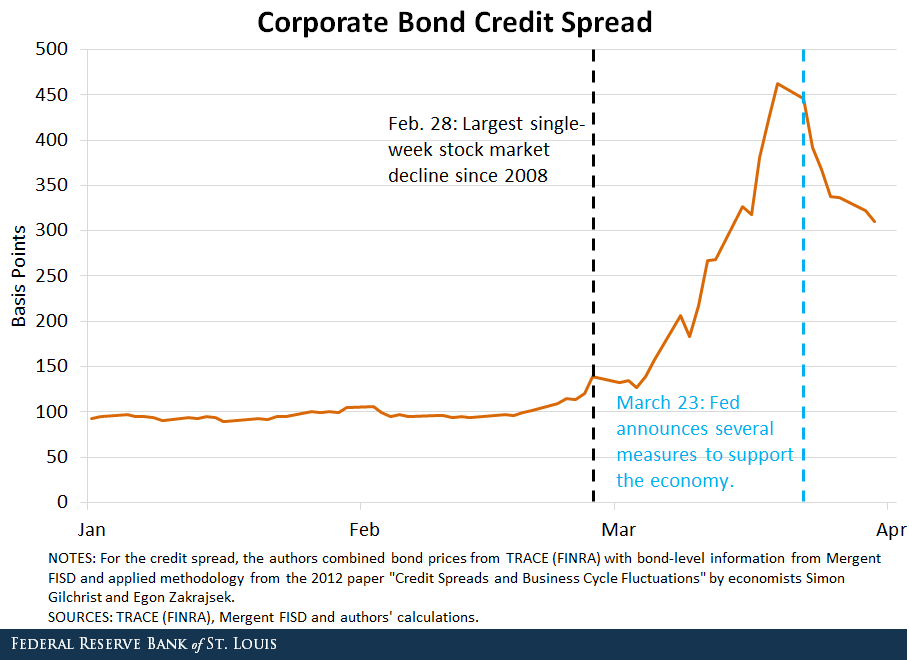
Figure 8. Daily corporate bond credit‐spread index from late Feb to April 2020. Source: St. Louis Fed.
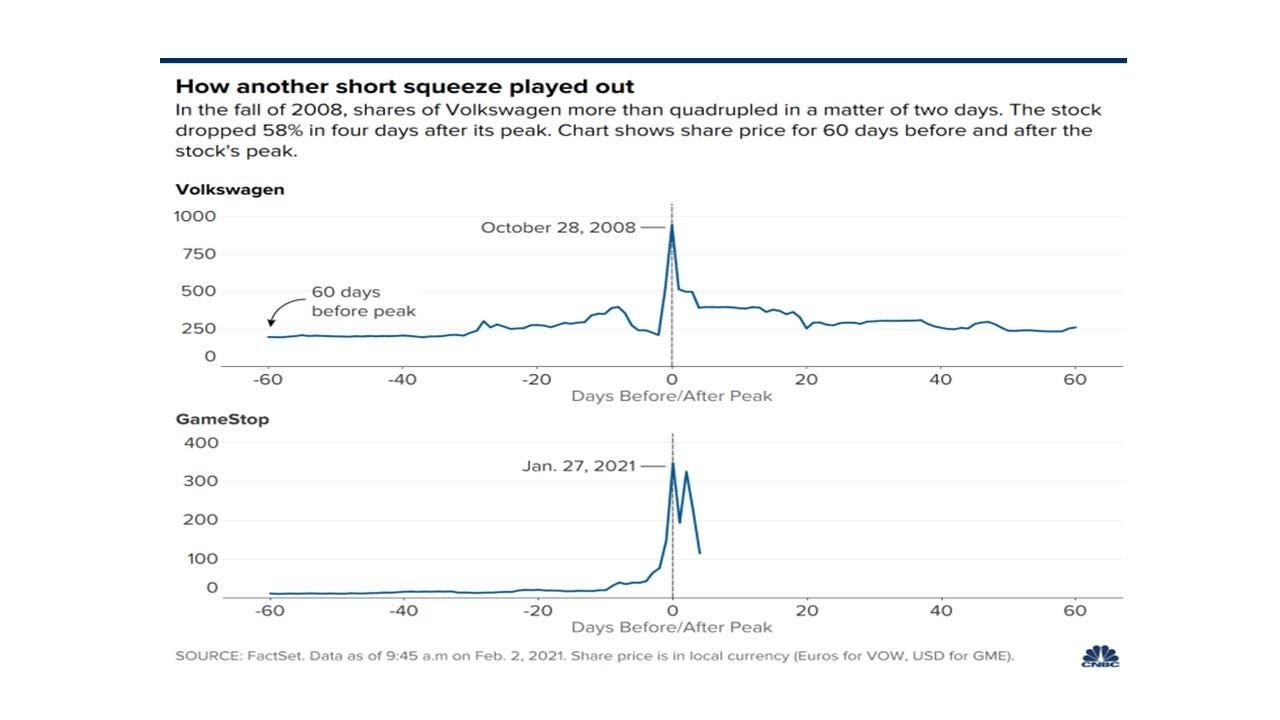
Figure 9. VW shares surged from around €210 to over €1,000 within days in late October 2008. Source: Market Realist via CNBC.
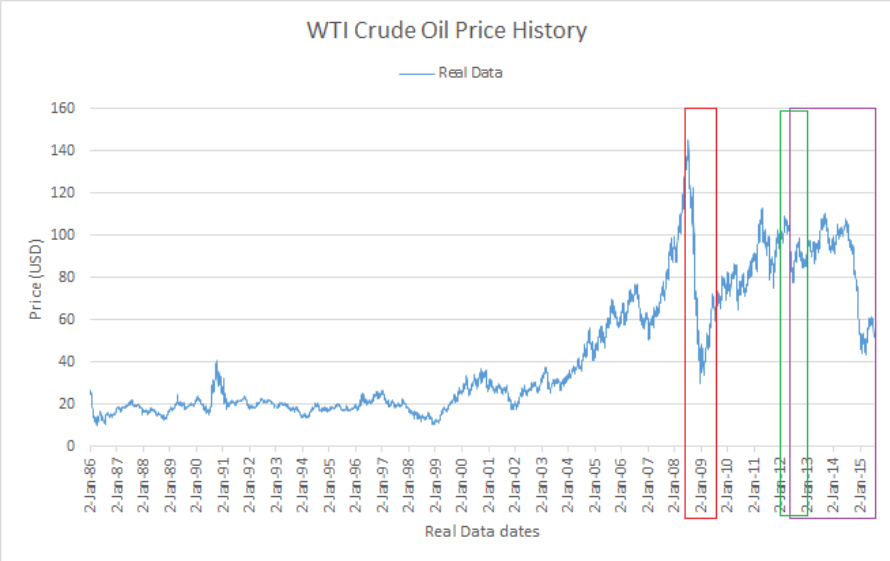
Figure 10. WTI crude oil price history from 1995–2015, with the 2003–2008 period highlighted. Source: ResearchGate.
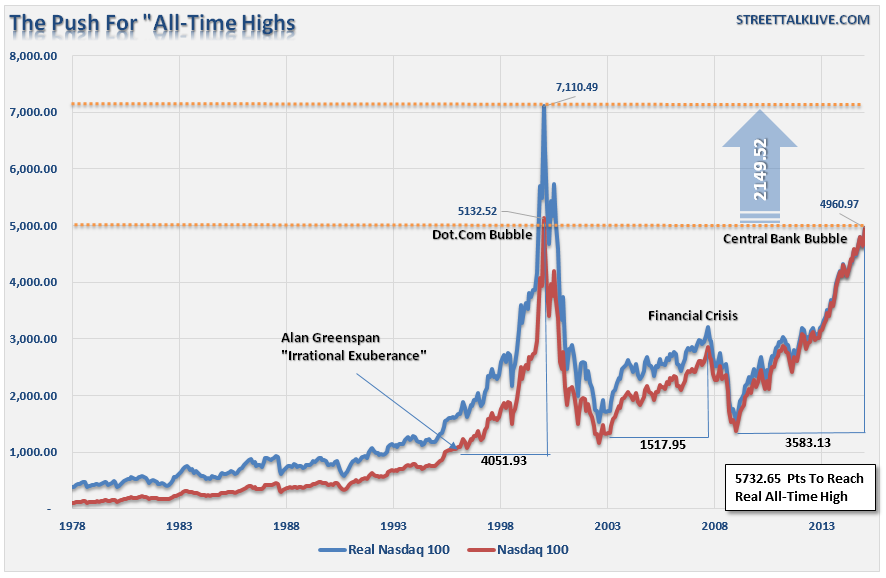
Figure 11. NASDAQ Composite vs. S&P 500, 1995–2002: Tech stocks exploded to over 5,000 by March 2000 before collapsing nearly 80% by late 2002. Source: ResearchGate.
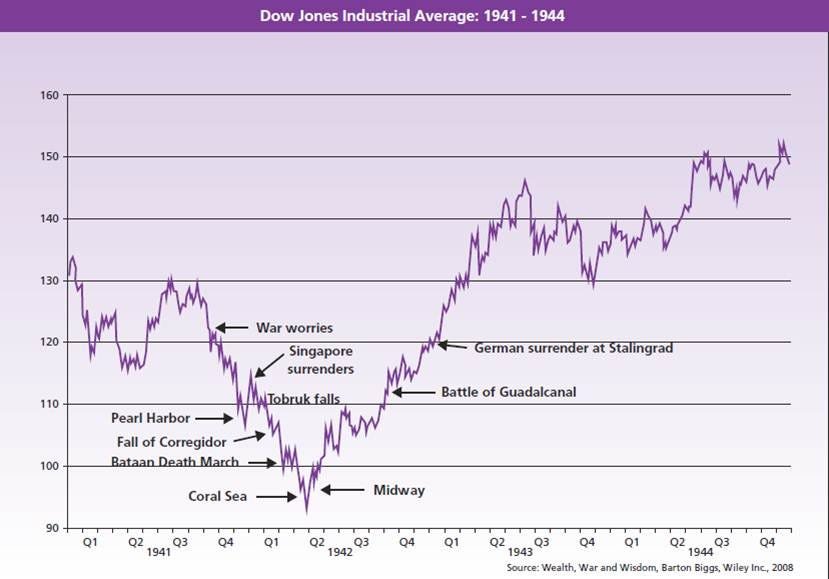
Figure 12. Dow Jones Industrial Average (1941–1944), which shows the May 1942 “point of maximum bearishness”. Source: InvestmentOffice.
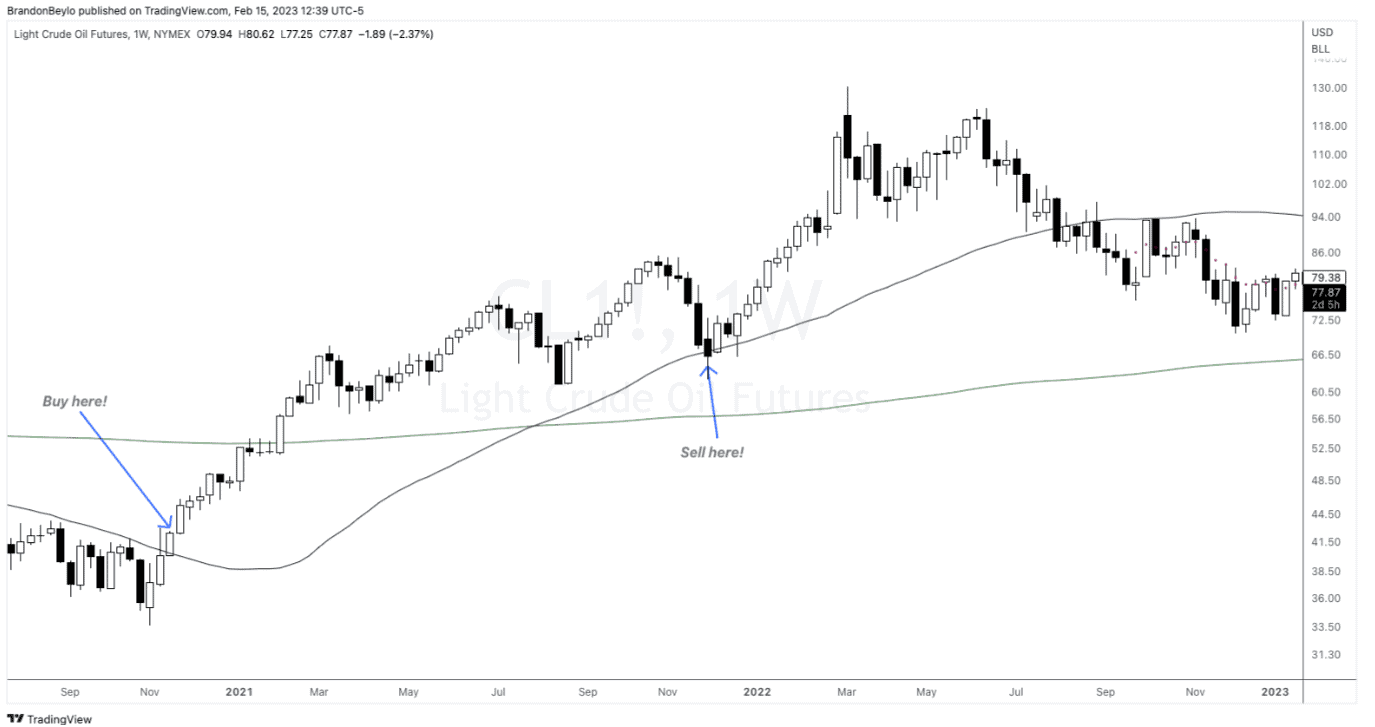
Figure 13. urtle Trading breakout system applied to crude oil futures. The buy signal is triggered as price breaks above resistance and the moving average. The sell signal appears when price closes back below the trend line. Source: Source: TradingView/BrandonBeylo.

Newsletter