Back To Top

Volatility Mean-Reversion

Implied vs realized volatility, stationarity, mean-reversion speed, and regime shifts.

Vol Structure & Pricing Gap

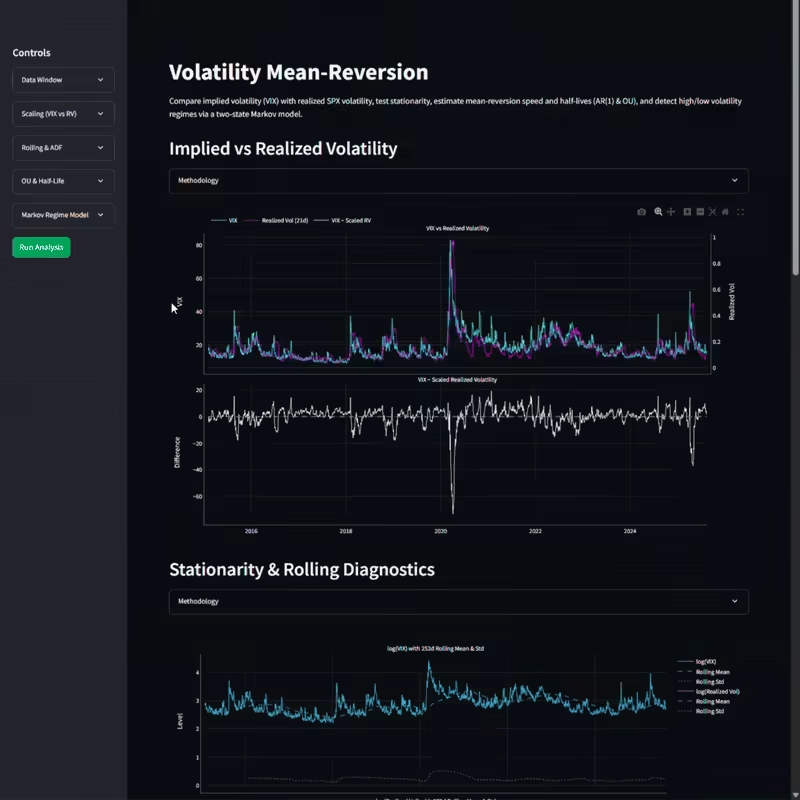
Track the gap between implied volatility (VIX) and realized volatility on the S&P 500. Spot when implied risk premium looks stretched relative to actual market moves.

Mean-Reversion Diagnostics

View how quickly volatility shocks tend to fade. Half-life metrics show whether current volatility is likely to persist or decay back toward its norm.

Regime Detection

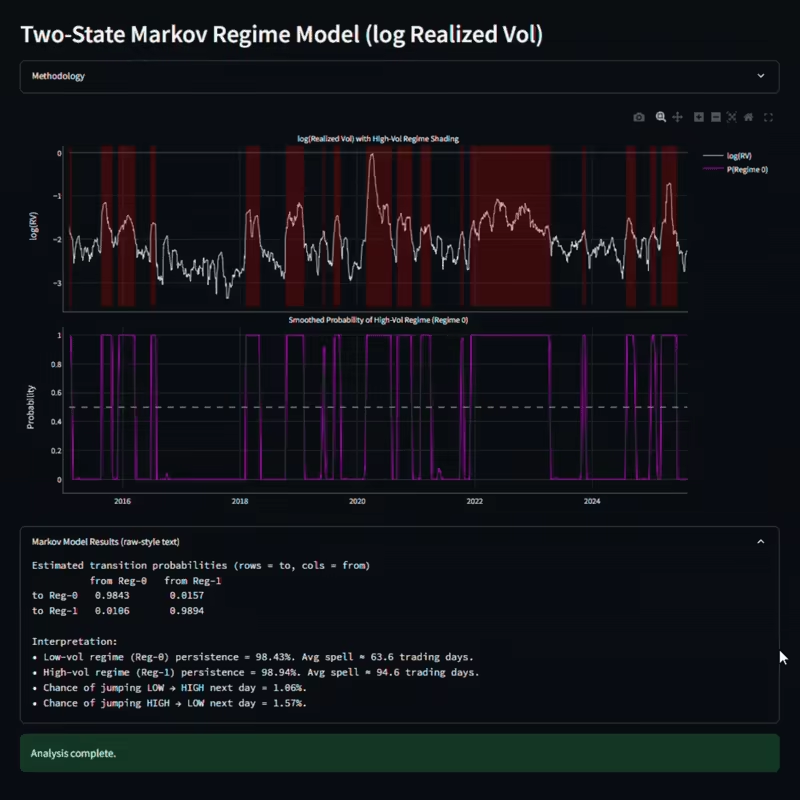
Identify when the market is in a low-vol or high-vol state. Transition odds and streak lengths provide context for positioning and risk management.

Key Features

  • Live comparison of VIX vs realized volatility.

  • Pricing gap series to flag stretched premium or underpricing.

  • Indicators of volatility persistence and mean-reversion speed.

  • Clear low-vol vs high-vol regime classification.

  • Probabilities for regime shifts and average spell lengths.

  • Historical context to see how current vol compares to past regimes.

Volatility Mean Reversion Tool Demo 2 AVIF
Volatility Mean Reversion Tool Demo 1 AVIF

70,000+ Assets

Driving Analytics for Retail Investors

Get Started

Monthly

$8/month

Annual

$99 $75/Year

Free

Free