Back To Top

Market Memory with Autocorrelation

See how current price, return, or volatility behavior relates to past patterns

Repeating Behavior with Autocorrelation Maps

See how today’s market structure aligns with past conditions. The tool computes rolling autocorrelations between the latest prices, returns, or volatility and dozens of past time windows.

Momentum and Reversion Across Timeframes

The heatmaps show when recent behavior is positively or negatively correlated with the past. You can track signals of momentum or mean reversion at various depths.

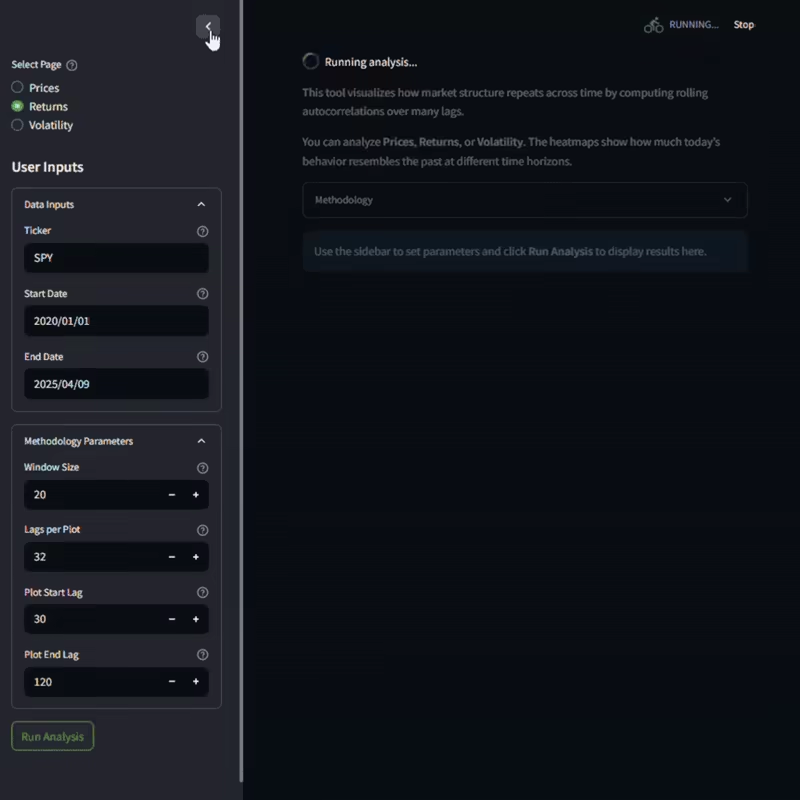
Tailor the Analysis to Fit Your Market Focus

Choose the lag range, number of bands, and smoothing logic. Whether you're tracking short-term return bursts or long-term volatility cycles, the tool adjusts to your timeframe. You can fine-tune how much history to compare and how granular the lag resolution should be.

Key Features

  • Analyzes autocorrelation across a wide range of time lags
  • Supports three real-time data types: prices, returns, and volatility
  • Heatmap colors show whether behavior is persistent, reversing, or neutral
  • Customizable lag ranges and window lengths
  • Smooths price inputs using Ehlers-style filter for cleaner structure
  • Highlights structural shifts, recurring cycles, or randomness
  • Ideal for detecting setups, timing entries, or confirming regime bias
Autocorrelation Periodogram Demo 2 AVIF
Autocorrelation Periodogram Demo 1 AVIF

70,000+ Assets

Driving Analytics for Retail Investors

Get Started

Monthly

$8/month

Annual

$75/Year

Free

Free