Back To Top

Market Breadth & Momentum

Trend quality, participation, and momentum across the S&P 500

Breadth and Trend Quality

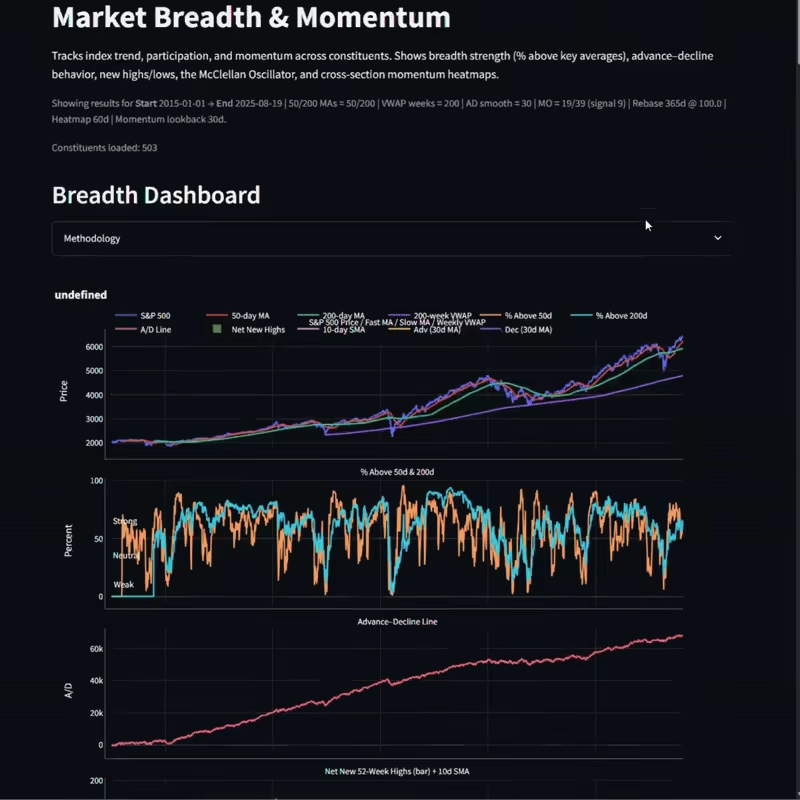
See % of stocks above the 50-day and 200-day MAs. Track A/D line, net new 52-week highs vs lows, and McClellan Oscillator. Check index vs 50/200-day MAs and anchored VWAP to judge structure.

Concentration and Dispersion

Compare constituents on a rebased, log-scale view over a set window. Review equal-weight vs index, Top-10 contribution share, and MAG7 vs the rest. Scan cross-section std, IQR, and median correlation to the index.

Momentum Maps

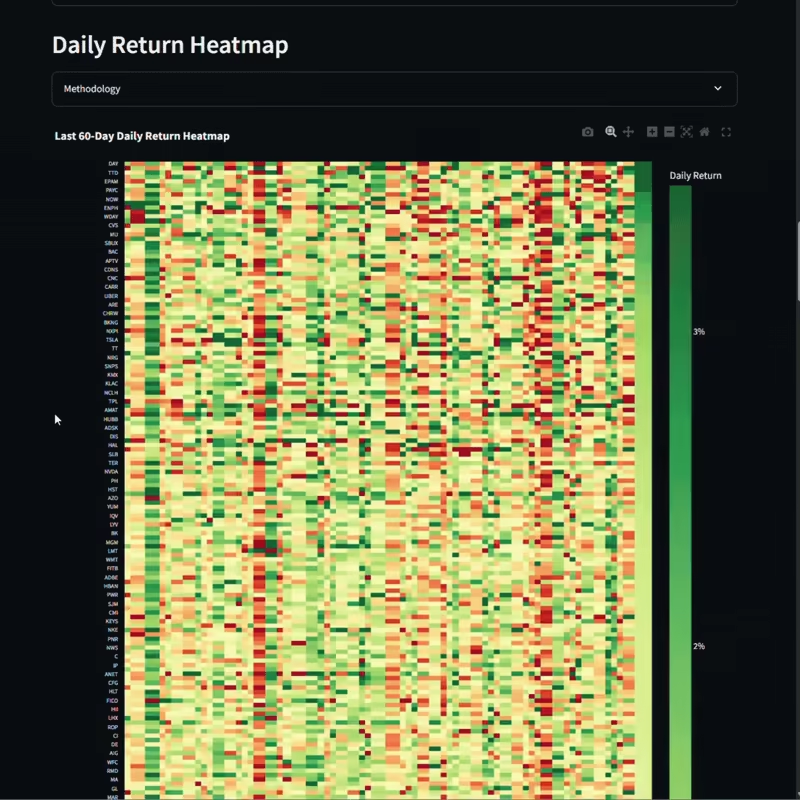
Daily return heatmap highlights broad up/down days and rotation. Percentile momentum heatmap ranks n-day returns each day. Use top/bottom quintile persistence lists for follow-through checks.

Key Features

  • % above 50-day and 200-day MAs with weak/neutral/strong zones.

  • A/D line, smoothed advancers vs decliners, and net new highs/lows.

  • McClellan Oscillator with zero-line and signal-line crosses.

  • Index trend: 50/200-day MAs, slopes, and ~200-week VWAP.

  • “Breadth thrust” detector via 50-day participation jump.

  • Rebased, log-scale comparison over N sessions; leaders and laggards marked.

  • Equal-weight vs index gap, Top-N contribution share, MAG7 split.

  • Dispersion stats (std, IQR) and median correlation to the index.

  • Daily return heatmap with color caps (P95).

  • Percentile momentum heatmap with top/bottom 20% breadth and persistence.
Breath and Momentum Tool Demo 2 AVIF
Breath and Momentum Tool Demo 1 AVIF

70,000+ Assets

Driving Analytics for Retail Investors

Get Started

Monthly

$8/month

Annual

$99 $75/Year

Free

Free