Back To Top
Skip to content
Neural Trade
Guides
Tools
Price Forecasting
Deep Learning Price Prediction
Option-Based Forward Prices
Stock Prices Simulations
Future Price Bootstrapping
Expected Price Movement
Volatility Forecasting
Stock Movement Probability
Conditional Price Probability
Market Indicators
Market Breadth & Momentum
Market Cycle Classification
Price Support & Resistance
Key Price Movements
Yield Curve Analytics
Market Crash Identification
Key Recession Indicators
Herding Behaviour
Trends and Patterns
Unsupervised Pattern Recognition
Detect Market Inefficiencies
Technical Indicator Signals
Candlestick Patterns Detection
Stocks Pattern Recognition
Autocorrelation Periodogram
Long-Term Memory Analysis
Moving Average Techniques
Price Descriptive Statistics
Volatility Squeeze Detection
Portfolio and Risk
Options Sentiment Analysis
VIX Term Structure
Portfolio Optimization
Stock Fair Value Calculation
Volatility Mean-Reversion
Dynamic Risk Management
Pairs Trading Analysis
Factor Exposure & Mispricing
Portfolio Risk with Copulas
Optimal Stop-Loss
News and Research
Stock Screener
AI-powered Financial Analysis
Earnings Announcements
Trending Social Sentiment
AI Web Research Assistant
Market News and Sentiment
AI Earnings Due Diligence
Scientific Knowledge Retrieval
AI-Powered 10-K Research
Algorithmic Trading
Self-Tuning Trading Signals
Moving Average Envelope
Bollinger Bands and RSI
Pivot Point-RSI Volatility
Triple Moving Average
Optimized Mean-Reversion
Moving Average Cross-Over
Calendars & Events
Economic Calendar
Initial Public Offerings
Corporate Calendar
Equity Offerings
Crowdfunding Feed
Press Releases
Institutional Activity
Institutional Portfolios
Congress Stock Trades
Real-Time SEC Fillings
Insiders Trading
ETF Allocations
M&A Transactions
Core Financials
Valuation Multiples
Dynamic F-Score Analyzer
ROE Decomposition
Financial Growth Metrics
Key Financial Ratios
Financial Statements Analysis
Quantify Bankruptcy Risk
Analyst Estimates
Analyst Price Targets
Upgrades & Downgrades
Analyst Forecasts
Analyst Recommendations
Market Microstructure
Volatility Signature Analysis
High-Frequency Price Reversals
Bid-Ask Spread Estimation
News
Stock Market
Forex Market
Crypto Market
General News
Memberships
Login
Close
Neural Trade
Guides
Tools
Price Forecasting
Deep Learning Price Prediction
Option-Based Forward Prices
Stock Prices Simulations
Future Price Bootstrapping
Expected Price Movement
Volatility Forecasting
Stock Movement Probability
Conditional Price Probability
Market Indicators
Market Breadth & Momentum
Market Cycle Classification
Price Support & Resistance
Key Price Movements
Yield Curve Analytics
Market Crash Identification
Key Recession Indicators
Herding Behaviour
Trends and Patterns
Unsupervised Pattern Recognition
Detect Market Inefficiencies
Technical Indicator Signals
Candlestick Patterns Detection
Stocks Pattern Recognition
Autocorrelation Periodogram
Long-Term Memory Analysis
Moving Average Techniques
Price Descriptive Statistics
Volatility Squeeze Detection
Portfolio and Risk
Options Sentiment Analysis
VIX Term Structure
Portfolio Optimization
Stock Fair Value Calculation
Volatility Mean-Reversion
Dynamic Risk Management
Pairs Trading Analysis
Factor Exposure & Mispricing
Portfolio Risk with Copulas
Optimal Stop-Loss
News and Research
Stock Screener
AI-powered Financial Analysis
Earnings Announcements
Trending Social Sentiment
AI Web Research Assistant
Market News and Sentiment
AI Earnings Due Diligence
Scientific Knowledge Retrieval
AI-Powered 10-K Research
Algorithmic Trading
Self-Tuning Trading Signals
Moving Average Envelope
Bollinger Bands and RSI
Pivot Point-RSI Volatility
Triple Moving Average
Optimized Mean-Reversion
Moving Average Cross-Over
Calendars & Events
Economic Calendar
Initial Public Offerings
Corporate Calendar
Equity Offerings
Crowdfunding Feed
Press Releases
Institutional Activity
Institutional Portfolios
Congress Stock Trades
Real-Time SEC Fillings
Insiders Trading
ETF Allocations
M&A Transactions
Core Financials
Valuation Multiples
Dynamic F-Score Analyzer
ROE Decomposition
Financial Growth Metrics
Key Financial Ratios
Financial Statements Analysis
Quantify Bankruptcy Risk
Analyst Estimates
Analyst Price Targets
Upgrades & Downgrades
Analyst Forecasts
Analyst Recommendations
Market Microstructure
Volatility Signature Analysis
High-Frequency Price Reversals
Bid-Ask Spread Estimation
News
Stock Market
Forex Market
Crypto Market
General News
Memberships
Login
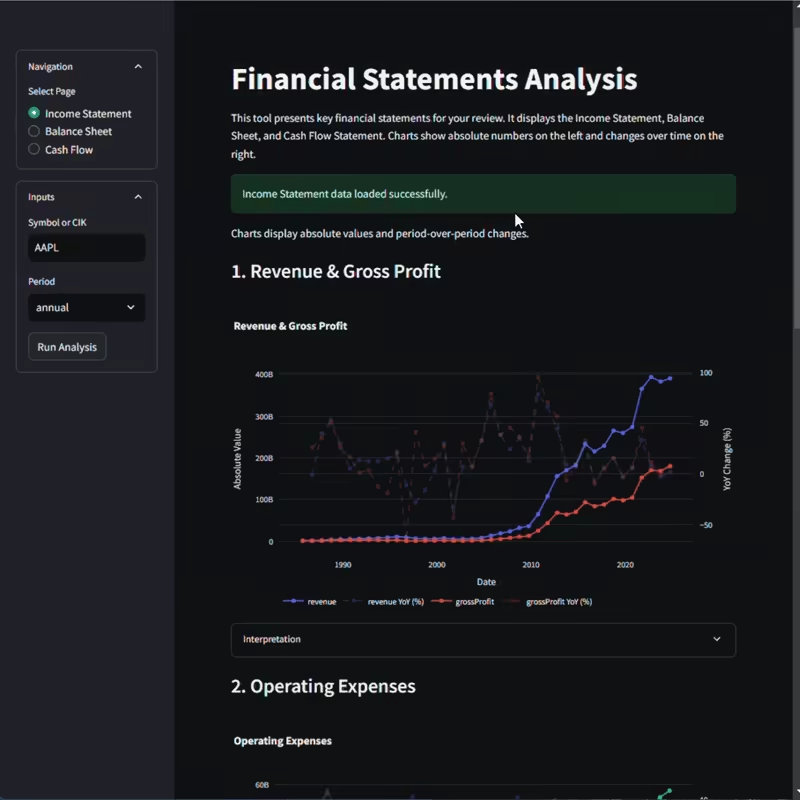
Financial Statements Analysis
Interactive Income Statement, Balance Sheet, and Cash Flow Insights
Analyze Financial Statements with Clarity
Access detailed breakdowns of income, balance sheet, and cash flow data, with historical trends and performance comparisons.
Track Period-over-Period Changesrval Predictions
See absolute values and year-over-year (YoY) or quarter-over-quarter (QoQ) percentage changes to identify financial trends.
Gain Actionable Insights from Data-Driven Analysis
Interpret key metrics like revenue growth, profitability, liabilities, and cash flow movements to assess financial health.
Key Features
Income Statement Analysis
– Track revenue, gross profit, net income, and expenses over time.
Balance Sheet Breakdown
– Monitor assets, liabilities, and stockholders’ equity trends.
Cash Flow Insights
– Understand operating, investing, and financing cash flows.
Historical Comparisons
– View absolute values and period-over-period percentage changes.
Interactive Data Visualizations
– Dual-axis charts for financial trends and YoY/QoQ growth.
Sign up to Annual Subscription
70,000+ Assets
Driving Analytics for Retail Investors
Get Started
_
Monthly
$8/month
Access to Advanced Investment Tools
Subscriber-Only Articles and Guides
High-Quality Solutions and Codebases
Archive of Technical Investment Guides
Premium Newsletters with the Latest Trends
Research and Due Diligence Reports
Unlimited Access to Investment Tools
Unlimited Access to Neural Trade
Get Started
Best Value
Annual
$99
$75/Year
All the Benefits of the Monthly Subscription
Unlimited Access to Nueral Trade
Unlimited Access to Investment Tools
Full Integration with Real-Time Market Data
Research and Due Diligence Reports
Content Assistant and Teaching Chatbot
Advisory and Consultation Sessions
Real-time Market Dashboards
Early access to new features and updates
Exclusive Investment Webinars
22% Cheaper Than Subscribing Monthly
Get Started
_
Free
Free
Free Technical Guides and Newsletters
Subscriber-Only Articles and Guides
High-Quality Solutions and Codebases
Premium Newsletters with the Latest Trends
Access to Advanced Investment Tools
Research and Due Diligence Reports
Unlimited Access to Neural Trade
Unlimited Access to Investment Tools
Get Started