Back To Top
Experience the Future of Intelligent Investing Today
Buying strength beats guessing direction. The best part is that you do not need a complex model to follow market strength.
One thing that has been clear in the last decade is that Assets that outperform tend to keep outperforming. At least in the short term.
Here, we present a strategy that applies that principle through weekly asset rotations.
It ranks a defined set of equities by their trailing 3-month returns and reallocates into the top performers each Friday.
Each week, the model evaluates recent performance, selects the top n assets, and holds them until the next rebalance.
If no asset shows positive momentum, it defaults to capital preservation by reducing exposure.
The complete Python notebook for the analysis is provided below.
This strategy is built on a simple belief: assets with strong recent performance are more likely to continue outperforming.
To capture that persistence, we use a ranking system based on trailing momentum.
Specifically, it ranks assets using trailing 3-month returns, selects the top performers, and rotates into them systematically every Friday.
The goal is to allocate capital to what’s already working, not to predict future winners.
The strategy operates on a fixed universe of assets.
In our example, it uses six large-cap U.S. equities:
["AAPL", "MSFT", "AMZN", "GOOGL", "TSLA", "NVDA"]
This can be replaced with any basket, e.g. sector ETFs, country indices, crypto, etc. It all depends on your use case.
Each asset is scored based on its return over a configurable trailing window, defined in days.
This window is controlled by the MOM_DAYS parameter:
MOM_DAYS = 63 # lookback period (e.g. 3 months)
The momentum score is computed as:
Pt is the price at time t.
Every Friday, the strategy performs the following:
If fewer than N assets meet the criteria, the model adjusts exposure accordingly.
This avoids forced allocation into weak assets and keeps the portfolio responsive to trend strength.
The number of assets held (TOP_N) is adjustable.
Returns are computed on an open-to-open basis to simulate execution at Monday’s open following a Friday signal.
This avoids lookahead bias and reflects how systematic strategies would operate in production.
The model includes optional transaction cost modeling using a fixed basis point adjustment on each rebalance. In this implementation:
COST_BPS = 5 # one-way cost
We benchmark the strategy against:
The complete strategy workflow is summarized below:
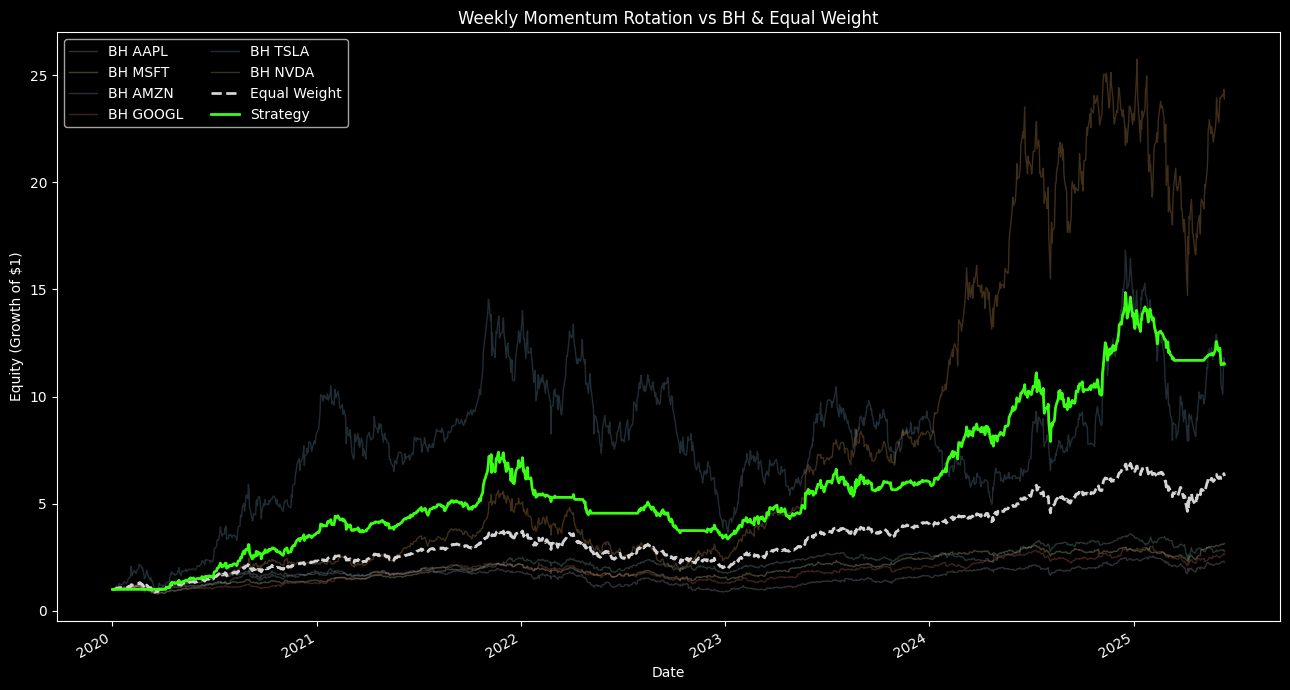
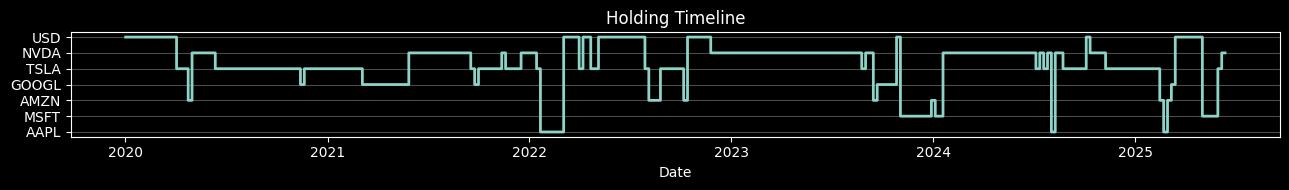
Figure 1. Step-by-step decision flow of the weekly momentum rotation strategy.
The implementation is structured to match the logic described above.
We define the universe of assets, lookback window for momentum, portfolio size, and configuration for rebalancing logic.
# 1. Params
TICKERS = ["AAPL","MSFT","AMZN","GOOGL","TSLA","NVDA"]
START_DATE = "2020-01-01"
END_DATE = "2025-07-01"
MOM_DAYS = 63 # ~3-month momentum
TOP_N = 2 # number of winners to select
USD_SECONDARY = True # allow USD as second slot when there is no 2nd winner
COST_BPS = 5 # one-way cost
We pull open and close prices from Yahoo Finance. The data is forward-filled and aligned across tickers.
# 2. Download OHLC
data = {}
for t in TICKERS:
df = yf.download(t,
start=START_DATE,
end=END_DATE,
interval="1d",
auto_adjust=True,
progress=False)
if isinstance(df.columns, pd.MultiIndex):
df.columns = df.columns.get_level_values(0)
data[t] = df.dropna()
opens = pd.concat([data[t]["Open"] for t in TICKERS], axis=1)
closes = pd.concat([data[t]["Close"] for t in TICKERS], axis=1)
opens.columns = TICKERS
closes.columns = TICKERS
Momentum is defined as the trailing 3-month return. Rebalancing happens only on Fridays.
Newsletter