Back To Top

Stock Earnings Announcements Analysis

Visualize and Estimate Price Movements Around Earnings Announcements

Advanced Data Science Techniques

Toolkit for analyzing the impact of earnings announcements on stock prices. It combines various analytical tools to help investors understand stock behavior around these key events. Users can visualize price movements, analyze volatility, and run simulations to predict future stock performance based on earnings data.
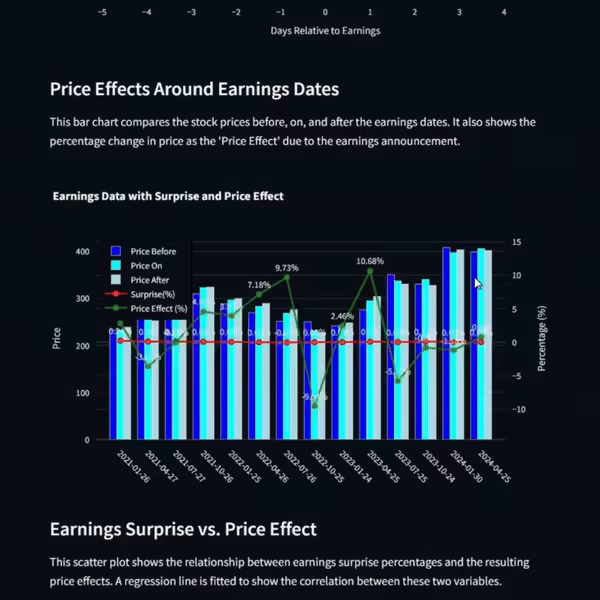
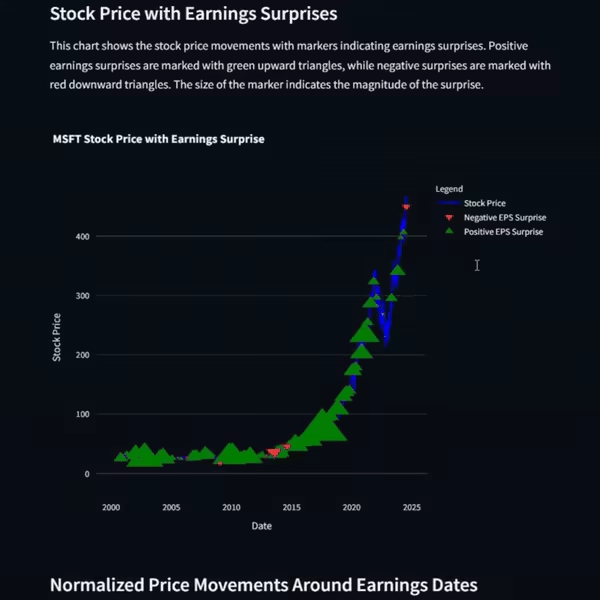
Stock Price Effects Around Earnings Announcements

Examine normalized stock price changes relative to earnings announcement dates. This helps you see consistent patterns in stock behavior around earnings, magnitude of price movements and the associated probabilities.

Probability of Movements Around Earnings

Use advanced statistical techniques to estimate future price movements and the probabilities of reaching specific price targets.

Key Features

  • Normalized Price Movements: Identify patterns and trends in stock behavior around earnings announcements.
  • Volatility Analysis: Understand the market’s uncertainty or confidence around earnings announcements.
  • Historical Price Effects: Compare the historical stock prices before, during, and after earnings announcements to quantify the impact. 
  • Implied Volatility (IV) Analysis:Anticipate market expectations and potential price swings, providing a statistical basis for investment strategies.
Earnings Announcements Analysis Tool Demo 2 Entreprenerdly
Earnings Announcements Analysis Tool Demo 1 Entreprenerdly

70,000+ Stocks

Driving Analytics for Retail Investors

Monthly

$8/Year

Annual

$75/Year

Free

Free