Towards Real-Time Automated Pattern Recognition using TA-Lib for Precision Pattern Scanning with Historical Accuracy Measures
Candlestick patterns, formed by the movement of stock prices over time, offer a visual representation of market sentiment and potential price movements. In this article, we will explore how these patterns can be automatically scanned, implemented and visualized using Python.
Furthermore, we will provide plug and play code to only simplify the process of automtically identifying candlestick patterns but also to assess the historical reliability of these patterns. Furthermore, we will explain the logic behind each of the 61 patterns covered in our solution.
While some traders swear by their predictive power, others approach them with a degree of skepticism. Our discussion aims to provide a balanced view, helping you understand the value and limitations of candlestick patterns in trading and financial analysis.
1. Candlestick Patterns in Trading
Candlestick patterns are a cornerstone of technical analysis in the stock market. These patterns, derived from the Japanese rice traders of the 18th century, have stood the test of time, offering insights into market psychology and potential price movements.
1.1 Understanding Candlestick Patterns
Each candlestick pattern tells a unique story about the market’s sentiment. By analyzing the size, shape, and position of the candles, traders can aim to gauge the strength, weakness, and potential direction of the market. This visual representation simplifies complex market data, making it accessible even to novice traders.
1.2 The Value in Financial Analysis
Candlestick patterns are more than just historical representations; they aim to provide a predictive element to stock analysis. Traders use these patterns to identify potential reversals or continuations in the market, aiding in decision-making for buying, selling, or holding stocks.
1.3 Historical Reliability and Significance
While candlestick patterns are widely used, their historical reliability varies. Some patterns have a strong track record of predicting market movements, while others might be less consistent. That’s why It’s crucial to use these patterns in conjunction with other market analysis tools to make informed trading decisions.
2. Python Implementation
2.1 Candlestick Patterns Covered
We now discuss the practical aspects of implementing candlestick pattern analysis using Python. We’ll cover a range of patterns, each with its own significance in the market analysis. These patterns are encoded into functions within the TA-Lib library, making their identification in market data both streamlined and efficient.
Moreover, each of these patterns is associated with specific market sentiments and potential price movements. For example, ‘Three Black Crows’ may indicate a bearish reversal, while ‘Three Inside Up’ could suggest a bullish turnaround. Readers are encouraged to visit the Ta-Lib resources to understand more their Pattern Recognition implementation.
					pattern_funcs = [
    ("Two Crows", talib.CDL2CROWS),
    ("Three Black Crows", talib.CDL3BLACKCROWS),
    ("Three Inside Up/Down", talib.CDL3INSIDE),
    ("Three-Line Strike", talib.CDL3LINESTRIKE),
    ("Three Outside Up/Down", talib.CDL3OUTSIDE),
    ("Three Stars In The South", talib.CDL3STARSINSOUTH),
    ("Three Advancing White Soldiers", talib.CDL3WHITESOLDIERS),
    ("Abandoned Baby", talib.CDLABANDONEDBABY),
    ("Advance Block", talib.CDLADVANCEBLOCK),
    ("Belt-hold", talib.CDLBELTHOLD),
    ("Breakaway", talib.CDLBREAKAWAY),
    ("Closing Marubozu", talib.CDLCLOSINGMARUBOZU),
    ("Concealing Baby Swallow", talib.CDLCONCEALBABYSWALL),
    ("Counterattack", talib.CDLCOUNTERATTACK),
    ("Dark Cloud Cover", talib.CDLDARKCLOUDCOVER),
    ("Doji", talib.CDLDOJI),
    ("Doji Star", talib.CDLDOJISTAR),
    ("Dragonfly Doji", talib.CDLDRAGONFLYDOJI),
    ("Engulfing Pattern", talib.CDLENGULFING),
    ("Evening Doji Star", talib.CDLEVENINGDOJISTAR),
    ("Evening Star", talib.CDLEVENINGSTAR),
    ("Up/Down-gap side-by-side white lines", talib.CDLGAPSIDESIDEWHITE),
    ("Gravestone Doji", talib.CDLGRAVESTONEDOJI),
    ("Hammer", talib.CDLHAMMER),
    ("Hanging Man", talib.CDLHANGINGMAN),
    ("Harami Pattern", talib.CDLHARAMI),
    ("Harami Cross Pattern", talib.CDLHARAMICROSS),
    ("High-Wave Candle", talib.CDLHIGHWAVE),
    ("Hikkake Pattern", talib.CDLHIKKAKE),
    ("Modified Hikkake Pattern", talib.CDLHIKKAKEMOD),
    ("Homing Pigeon", talib.CDLHOMINGPIGEON),
    ("Identical Three Crows", talib.CDLIDENTICAL3CROWS),
    ("In-Neck Pattern", talib.CDLINNECK),
    ("Inverted Hammer", talib.CDLINVERTEDHAMMER),
    ("Kicking", talib.CDLKICKING),
    ("Kicking - bull/bear determined by the longer marubozu", talib.CDLKICKINGBYLENGTH),
    ("Ladder Bottom", talib.CDLLADDERBOTTOM),
    ("Long Legged Doji", talib.CDLLONGLEGGEDDOJI),
    ("Long Line Candle", talib.CDLLONGLINE),
    ("Marubozu", talib.CDLMARUBOZU),
    ("Matching Low", talib.CDLMATCHINGLOW),
    ("Mat Hold", talib.CDLMATHOLD),
    ("Morning Doji Star", talib.CDLMORNINGDOJISTAR),
    ("Morning Star", talib.CDLMORNINGSTAR),
    ("On-Neck Pattern", talib.CDLONNECK),
    ("Piercing Pattern", talib.CDLPIERCING),
    ("Rickshaw Man", talib.CDLRICKSHAWMAN),
    ("Rising/Falling Three Methods", talib.CDLRISEFALL3METHODS),
    ("Separating Lines", talib.CDLSEPARATINGLINES),
    ("Shooting Star", talib.CDLSHOOTINGSTAR),
    ("Short Line Candle", talib.CDLSHORTLINE),
    ("Spinning Top", talib.CDLSPINNINGTOP),
    ("Stalled Pattern", talib.CDLSTALLEDPATTERN),
    ("Stick Sandwich", talib.CDLSTICKSANDWICH),
    ("Takuri (Dragonfly Doji with very long lower shadow)", talib.CDLTAKURI),
    ("Tasuki Gap", talib.CDLTASUKIGAP),
    ("Thrusting Pattern", talib.CDLTHRUSTING),
    ("Tristar Pattern", talib.CDLTRISTAR),
    ("Unique 3 River", talib.CDLUNIQUE3RIVER),
    ("Upside Gap Two Crows", talib.CDLUPSIDEGAP2CROWS),
    ("Upside/Downside Gap Three Methods", talib.CDLXSIDEGAP3METHODS)
]
2.2 Automation Master Script
To automate the detection and visualization of these patterns, we employ a combination of Python libraries: yfinance for data retrieval, TA-Lib for pattern recognition, and matplotlib/mplfinance for visualization.
2.2.1 Data Retrieval
First, we import necessary libraries and fetch historical stock data using yfinance.
					import yfinance as yf
import talib
import matplotlib.pyplot as plt
import pandas as pd
import mplfinance as mpf
import matplotlib.gridspec as gridspec

symbol = "SAP.DE"
data = yf.download(symbol, start="2020-01-01", end="2024-01-01")
2.2.2 Pattern Recognition
The next step involves identifying candlestick patterns using TA-Lib. We define a list of patterns and their corresponding TA-Lib functions. See the exhaustive list section 2.1.
					pattern_funcs = [
    ("Two Crows", talib.CDL2CROWS),
    ... # Other patterns
]
Each tuple in pattern_funcs contains the pattern’s name and the TA-Lib function that identifies it. These functions will be applied to the stock data to find occurrences of each pattern.
The complete master script provided below then iterates over this list, applying each function to the stock data:
					for pattern_name, pattern_func in pattern_funcs:
    data[pattern_name] = pattern_func(data['Open'], data['High'], data['Low'], data['Close'])
    pattern_dates = data[data[pattern_name] != 0].index
    ...
- For each pattern, the corresponding TA-Lib function is called with the Open, High, Low, and Close prices of the stock.
- The result is a series where non-zero values indicate the presence of the pattern. These dates are stored in
pattern_dates.
2.2.3 Visualization
The visualization segment of the master script then uses Matplotlib and mplfinance to graphically represent the stock data and the detected patterns.
					fig = plt.figure(figsize=(20, 10))
gs = gridspec.GridSpec(2, 4)

mc = mpf.make_marketcolors(up='g', down='r', inherit=True)
custom_style = mpf.make_mpf_style(marketcolors=mc)
...
- A figure and a grid layout are set up for plotting.
- Market colors are defined (green for up, red for down) and a custom style is created for mplfinance.
The script then plots the closing prices of the stock and highlights dates where patterns were found:
					ax1 = plt.subplot(gs[0, :3])
data[['Close']].plot(ax=ax1, color='blue')
for date in pattern_dates:
    ax1.axvline(date, color='red', linestyle='--', ...)
    ax1.annotate(date.strftime('%Y-%m-%d'), ...)
...
- The main subplot (
ax1) shows the stock’s closing prices. - Vertical lines and annotations are added on dates where patterns were identified, marked in red.
Finally, individual candlestick charts are plotted for each detected pattern:
					for i in range(5):
    if len(pattern_dates) > i:
        pattern_date = pattern_dates[-(i+1)]
        ...
        mpf.plot(subset, type='candle', ax=ax, ...)
        ax.set_title(f'{pattern_name} Pattern {i+1} for {symbol}')
        ...
- A loop is used to plot the last five occurrences of each pattern.
- For each occurrence, a subset of the data surrounding the pattern date is selected and plotted as a candlestick chart.
The script concludes with setting titles, labels, and layout adjustments before displaying the plot.
2.2.4 Complete Code
Putting all of the above together, we get the following code along with a sample output for one of the patterns
					import yfinance as yf
import talib
import matplotlib.pyplot as plt
import pandas as pd
import mplfinance as mpf
import matplotlib.gridspec as gridspec

# Retrieve data from yfinance
symbol = "SIE.DE"
data = yf.download(symbol, start="2020-01-01", end="2024-01-01")

for pattern_name, pattern_func in pattern_funcs:
    data[pattern_name] = pattern_func(data['Open'], data['High'], data['Low'], data['Close'])
    pattern_dates = data[data[pattern_name] != 0].index

    # Skip if there are no detected patterns of this type
    if len(pattern_dates) == 0:
        continue

    fig = plt.figure(figsize=(20, 10))
    gs = gridspec.GridSpec(2, 4)

    mc = mpf.make_marketcolors(up='g', down='r', inherit=True)
    custom_style = mpf.make_mpf_style(marketcolors=mc)

    ax1 = plt.subplot(gs[0, :3])
    data[['Close']].plot(ax=ax1, color='blue')
    for date in pattern_dates:
        ax1.axvline(date, color='red', linestyle='--', label=pattern_name if pattern_name not in [l.get_label() for l in ax1.lines] else "")
        ax1.annotate(date.strftime('%Y-%m-%d'), (date, data['Close'].loc[date]), xytext=(-15,10+20),
                     textcoords='offset points', color='red', fontsize=12, rotation=90)

    window = 5  # Days before and after the pattern
    for i in range(5):
        if len(pattern_dates) > i:
            pattern_date = pattern_dates[-(i+1)]

            start_date = pattern_date - pd.Timedelta(days=window)
            end_date = min(data.index[-1], pattern_date + pd.Timedelta(days=window))
            valid_dates = pd.date_range(start=start_date, end=end_date).intersection(data.index)

            subset = data.loc[valid_dates]

            if i == 0:
                ax = plt.subplot(gs[0, 3])
            else:
                ax = plt.subplot(gs[1, i-1])

            mpf.plot(subset, type='candle', ax=ax, volume=False, show_nontrading=False, style=custom_style)
            ax.set_title(f'{pattern_name} Pattern {i+1} for {symbol}')

            x_ticks = list(range(0, len(valid_dates), 1))
            x_labels = [date.strftime('%Y-%m-%d') for date in valid_dates]
            ax.set_xticks(x_ticks)
            ax.set_xticklabels(x_labels, rotation=90)

    ax1.set_title(f"{symbol} Stock Price and {pattern_name} Pattern Detection")
    ax1.legend(loc='best')
    ax1.grid(True)
    ax1.set_xlabel("Date")
    ax1.set_ylabel("Price")
    plt.tight_layout()
    plt.show()
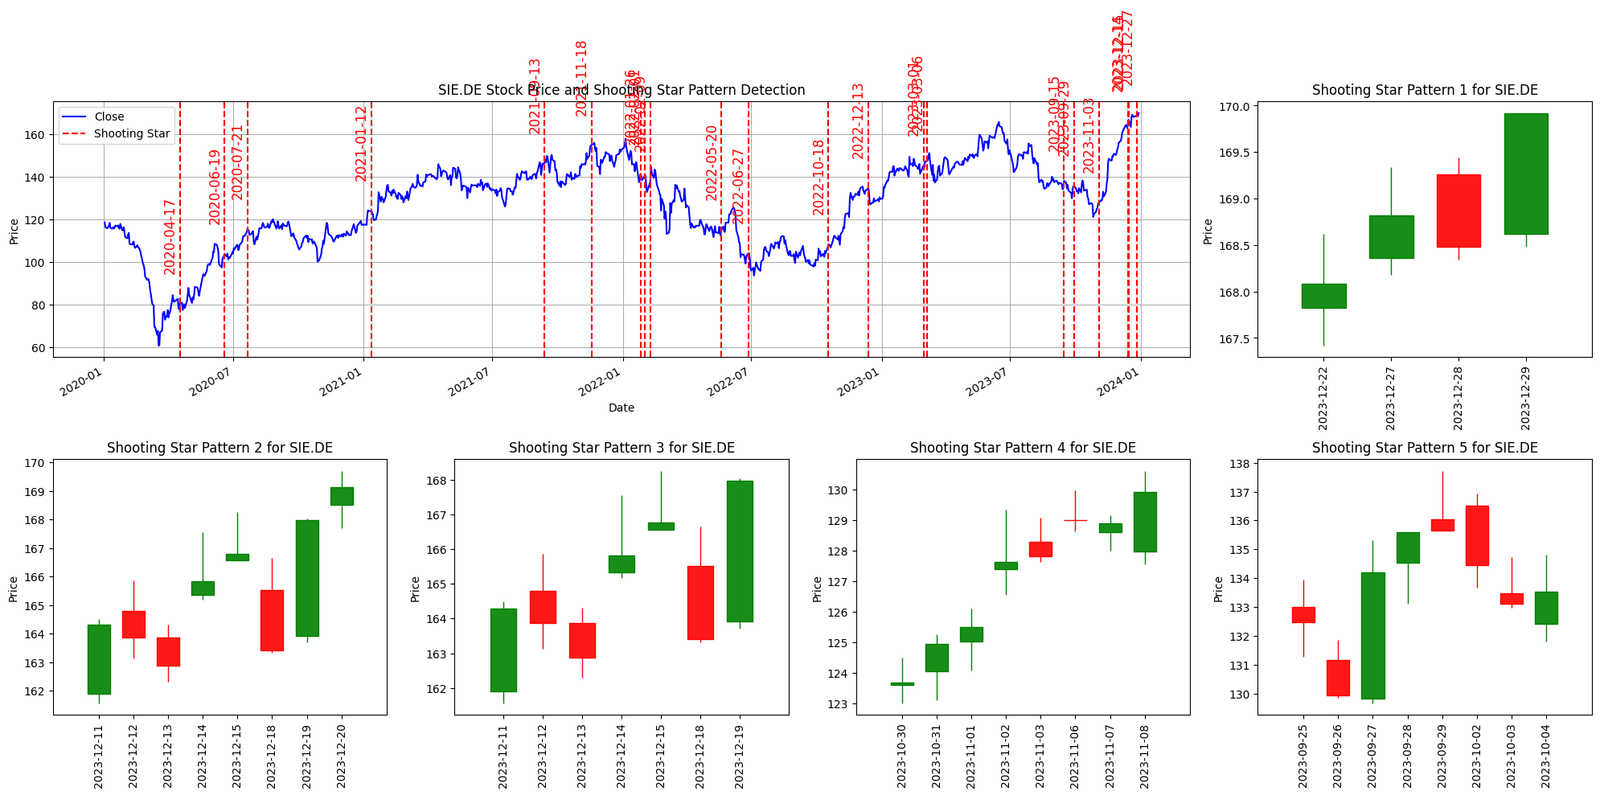
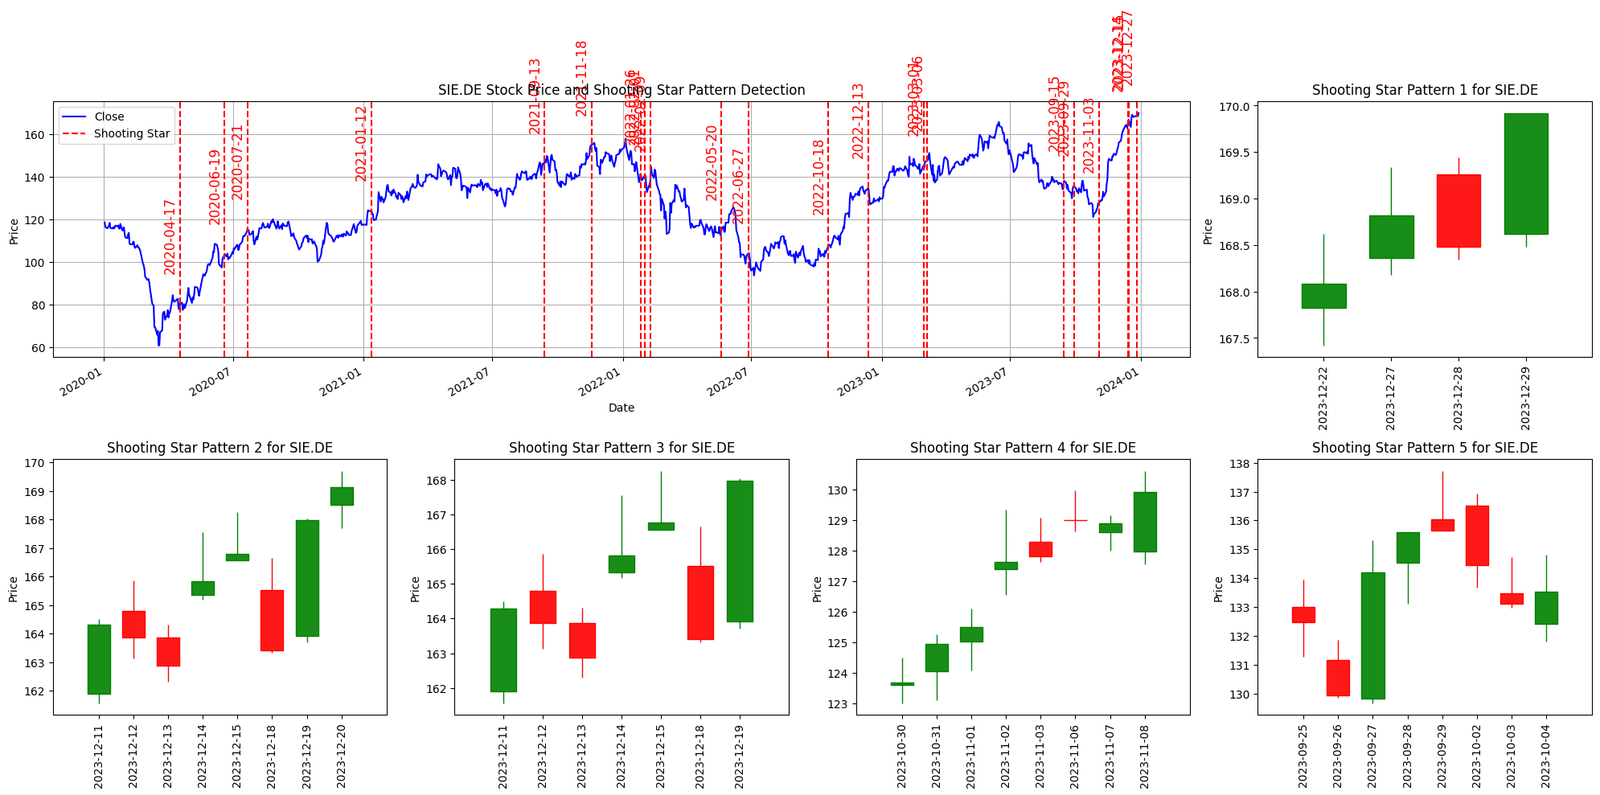
Figure. 1: Examples of the 'Morning Star' and 'Shooting Star' Pattern Detection and Visualization in the SIE.DE's Price Chart, Highlighting Specific Instances and Analyzing Resultant Price Trajectories
3. The 61 Candlestick Patterns Explained
3.1 Two Crows
The Two Crows is a bearish reversal pattern occurring in an uptrend and indicating a potential shift in momentum. It starts with a large green candle, followed by a smaller red candle that opens higher than the previous close but closes well within the body of the first candle.
Moreover, the third day sees another red candle, confirming the bearish trend. This pattern suggests that the bulls are losing control and the bears are gaining strength.
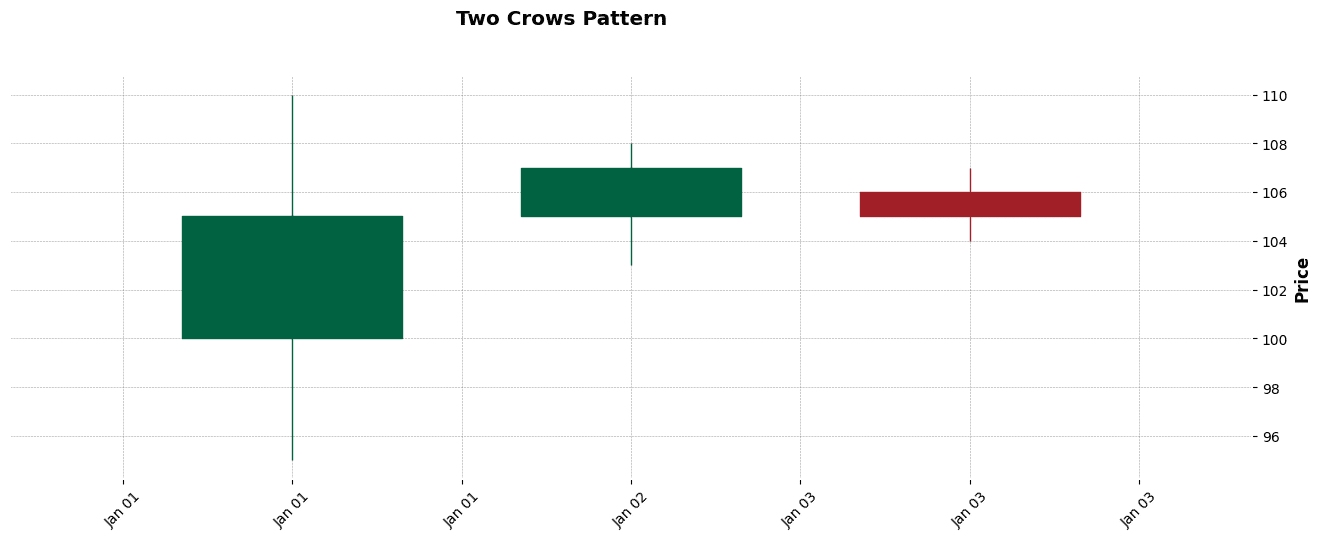
Figure. 2: Two Crows Candlestick Pattern Example.
3.2 Three Black Crows
The Three Black Crows pattern is a strong bearish reversal indicator. It consists of three consecutive long, red (or black) candles, each closing lower than the previous day, with short or nonexistent wicks.
Furthermore, this pattern typically emerges at the end of a bullish trend, indicating that a reversal is imminent. The steadily declining prices over three sessions demonstrate the growing dominance of bearish sentiment and the waning influence of the bulls.
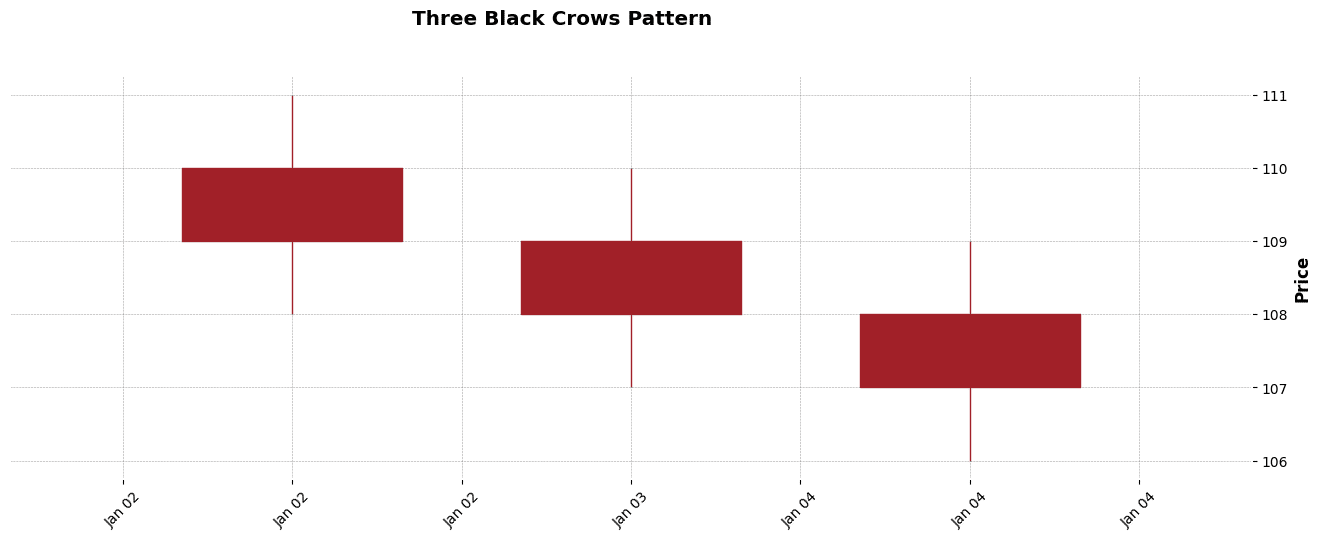
Figure. 3: Three Black Crows Candlestick Pattern Example.
3.3 Three Inside Up/Down
The Three Inside Up/Down pattern is a complex candlestick formation that signals a reversal in the current trend. The ‘Up’ variant is bullish and typically forms at the end of a downtrend.
It starts with a large red candle, followed by a smaller green candle that lies within the range of the first candle, and concludes with a green candle that closes above the high of the first candle.
Conversely, the ‘Down’ variant is bearish and forms at the end of an uptrend, following a similar but opposite pattern. These patterns suggest a shift in market sentiment and a potential change in price direction.
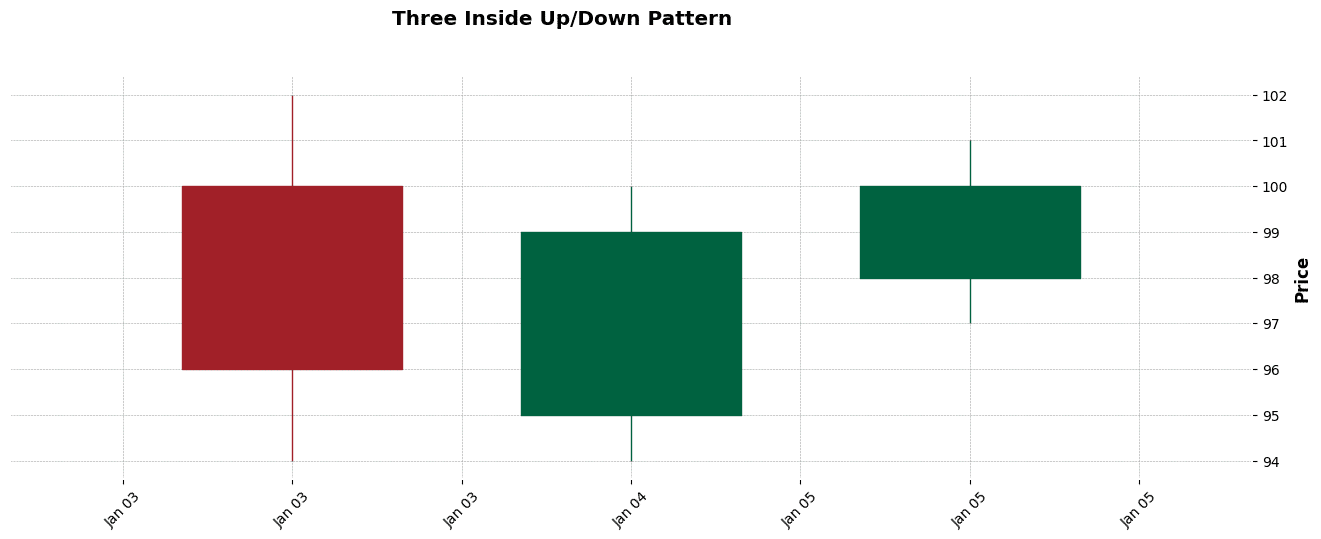
Figure. 4: Three-Line Strike Candlestick Pattern Example.
3.4 Three-Line Strike
The Three-Line Strike is a four-candlestick pattern that often indicates a continuation of the current trend but can also signal a potential reversal. The first three candles continue with the existing trend, each closing higher (in an uptrend) or lower (in a downtrend) than the previous one.
Furthermore, the fourth candle, however, strikes back in the opposite direction, opening at or near the previous candle’s close and closing significantly into the first candle’s body. This pattern is unique as it hints at a strong counter-move, which may either reinforce or reverse the current trend.

Figure. 5: Three-Line Strike Candlestick Pattern Example.
3.5 Three Outside Up/Down
The Three Outside Up/Down pattern is a three-candle formation that signals a reversal. The ‘Up’ variant starts with a bearish candle, followed by a large bullish candle that completely engulfs the first one and closes higher, indicating a bullish reversal.
The third candle, bullish again, confirms the uptrend. Conversely, the ‘Down’ variant begins with a bullish candle, followed by a bearish engulfing candle and another bearish candle, signaling a bearish reversal. This pattern indicates a strong shift in market sentiment.

Figure. 6: Three Outside Up/Down Candlestick Pattern Example.
3.6 Three Stars In The South
The Three Stars In The South is a rare bullish reversal pattern that typically forms in a downtrend. It consists of three small-bodied candles, each closing lower than the previous, but within a range of high-low decline.
Each successive candle opens within the body of the previous candle, suggesting a gradual weakening of the bearish trend. This subtle formation hints at a potential bullish turnaround as selling pressure diminishes.
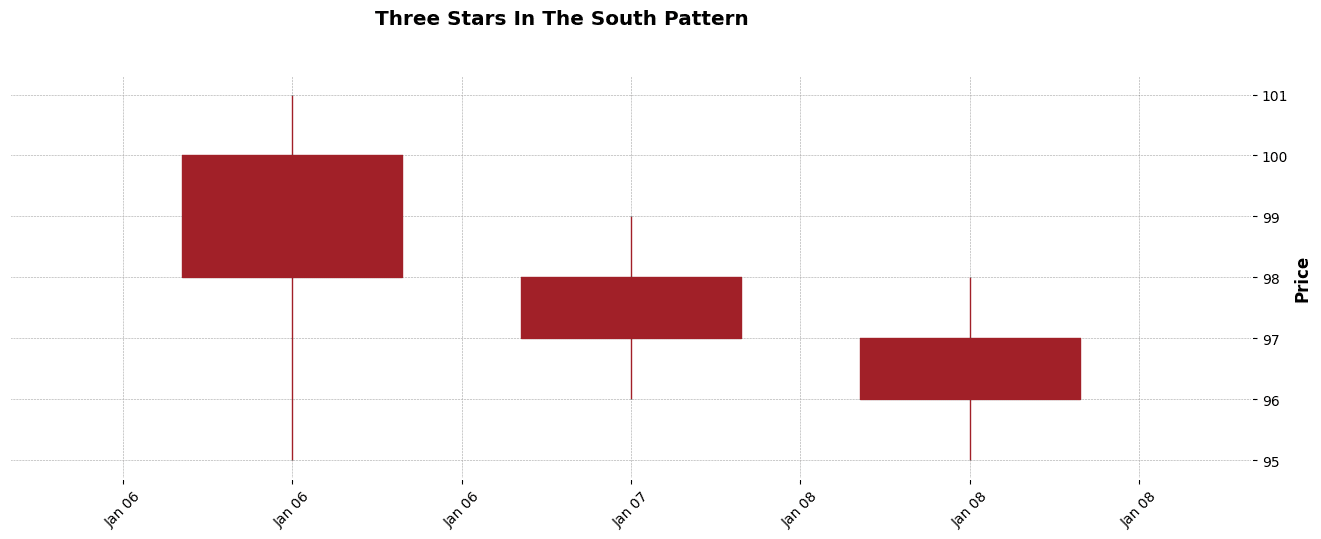
Figure. 7: Three Advancing White Soldiers Candlestick Pattern Example
3.7 Three Advancing White Soldiers
The Three Advancing White Soldiers is a bullish reversal pattern characterized by three consecutive long green candles with small wicks.
Furthermore, each candle opens within the body of the previous candle and closes at a new high, indicating a strong and steady advance. This pattern typically emerges after a prolonged downtrend and signals a shift towards bullish sentiment.
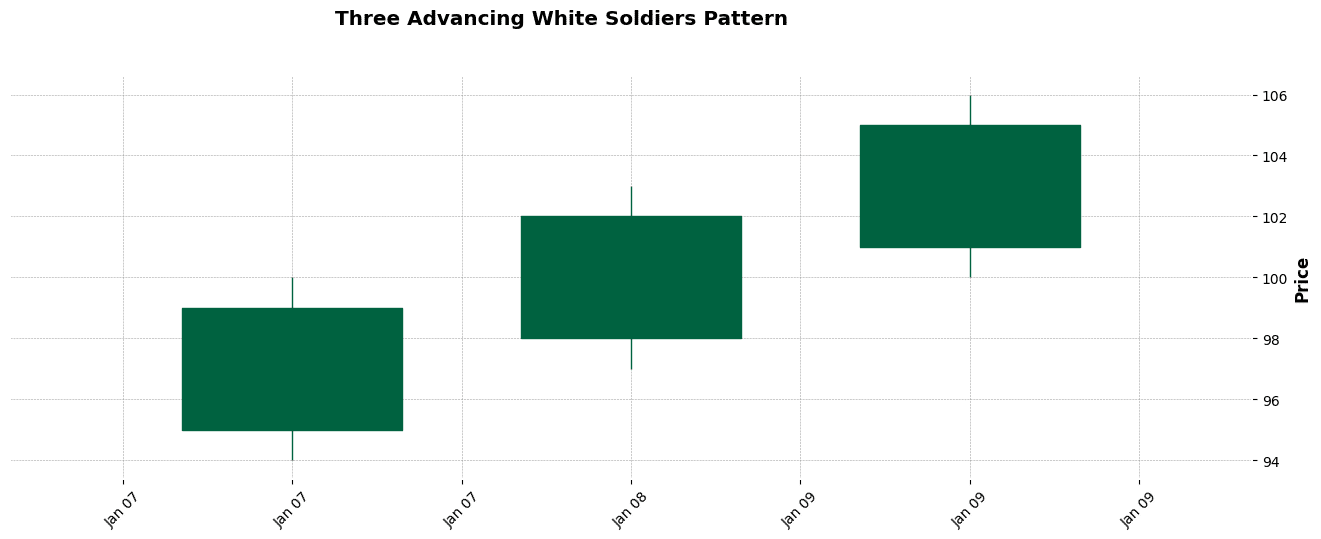
Figure. 8: Abandoned Baby Candlestick Pattern Example.
3.8 Abandoned Baby
The Abandoned Baby is a significant reversal pattern marked by a gap between the shadows of two candles and a Doji in the middle.
In a downtrend, the pattern starts with a long red candle, followed by a Doji that gaps below it, and then a green candle that gaps above the Doji, indicating a bullish reversal.
The reverse is true for a bearish reversal. This pattern is rare and suggests a strong change in market sentiment.
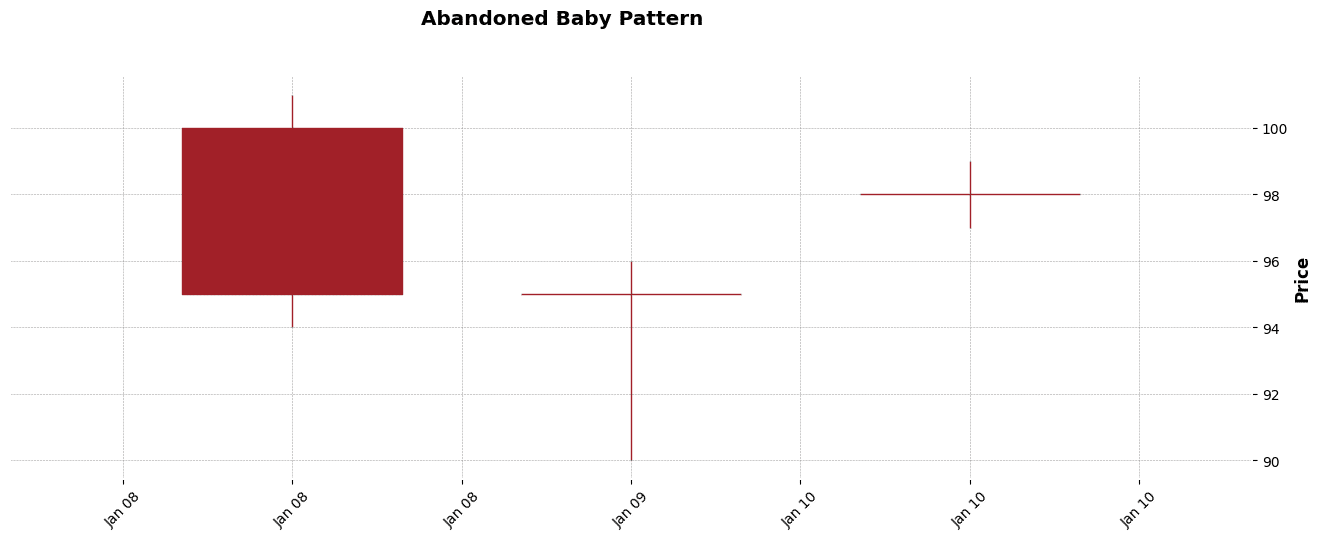
Figure. 9: Examples of the 'Morning Star' and 'Shooting Star' Pattern Detection and Visualization in the SIE.DE's Price Chart, Highlighting Specific Instances and Analyzing Resultant Price Trajectories
3.9 Advance Block
The Advance Block is a bearish reversal pattern observed in an uptrend. It’s characterized by three consecutive green (or white) candles, each with progressively smaller real bodies and longer upper shadows.
Moreover, this pattern suggests a loss of momentum and a weakening of the bullish trend, often signaling an upcoming reversal.
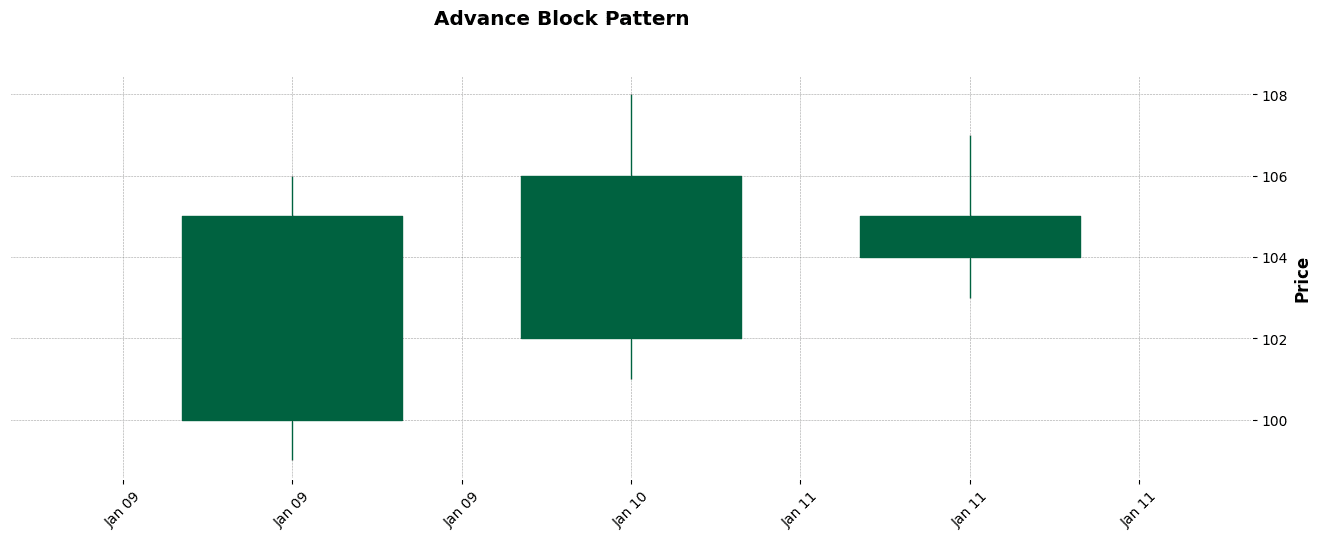
Figure. 10: Advance Block Candlestick Pattern Example.
3.10 Belt-hold
The Belt-hold pattern is a trend reversal pattern that appears as a long candle following a clear trend. A bullish Belt-hold opens at its low and closes near its high, often at the end of a downtrend.
Conversely, a bearish Belt-hold opens at its high and closes near its low, typically appearing at the end of an uptrend. This pattern signals a potential shift in market sentiment.
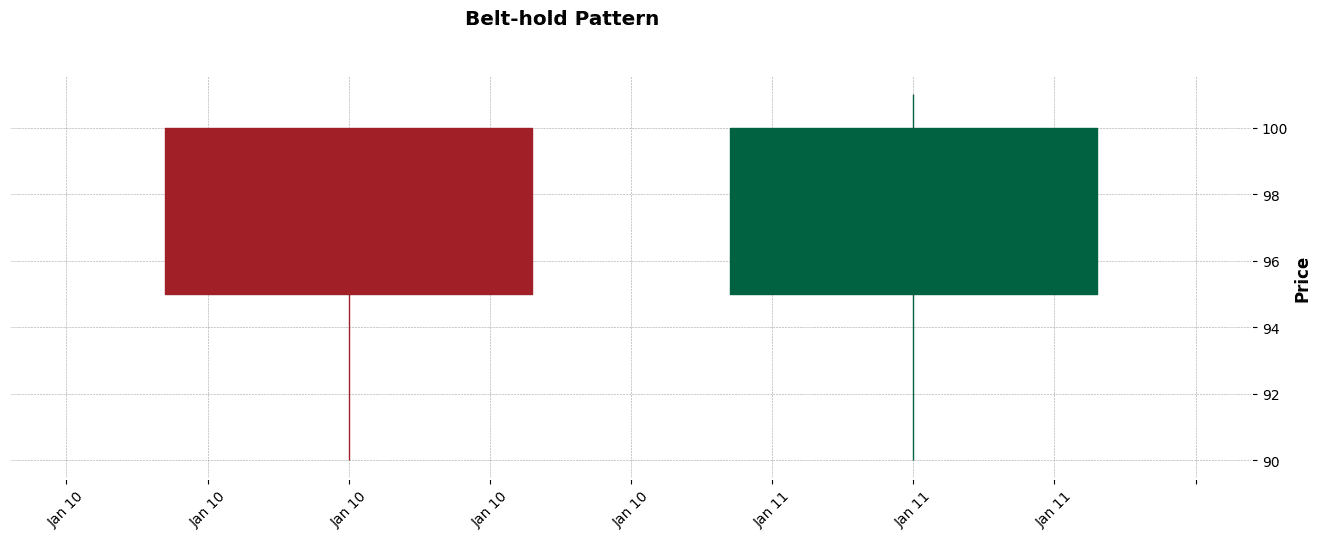
Figure. 11: Belt-hold Candlestick Pattern Example
3.11 Breakaway
The Breakaway pattern is a five-candle reversal pattern signaling the end of a trend and the start of a new direction. It begins with a strong trend candle, followed by three smaller consolidation candles and a final candle that breaks away in the opposite direction, confirming the reversal.

Figure. 12: Breakaway Candlestick Pattern Example.
3.12 Closing Marubozu
The Closing Marubozu is a single candle pattern with a large body and little to no shadow at one end. A bullish Closing Marubozu has a long green body with the close at its high, indicating strong buying pressure.
A bearish variant has a long red body with the close at its low, signifying strong selling pressure. This pattern often signals a continuation of the current trend.
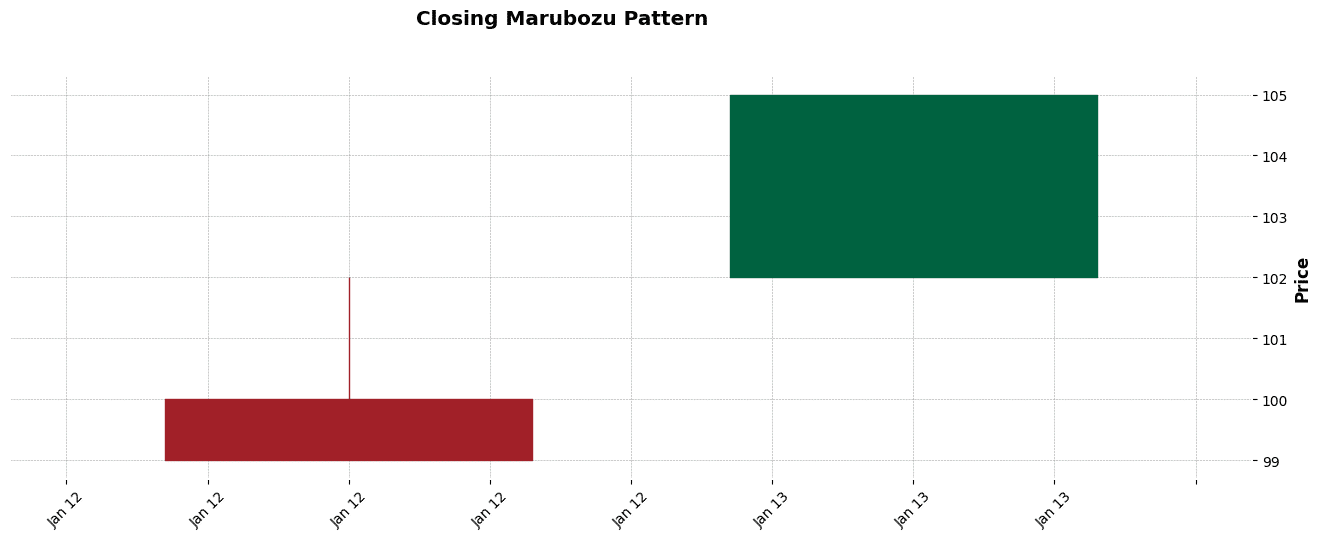
Figure. 13: Closing Marubozu Candlestick Pattern Example
3.13 Concealing Baby Swallow
The Concealing Baby Swallow is a rare bearish reversal pattern that appears during a downtrend. It consists of four candles.
The first two are large black (or red) candles within a downtrend, followed by two smaller black candles with short or no lower shadows.
The last two candles open within the body of the previous candle, signaling a weakening of the bearish trend and potentially indicating a reversal.
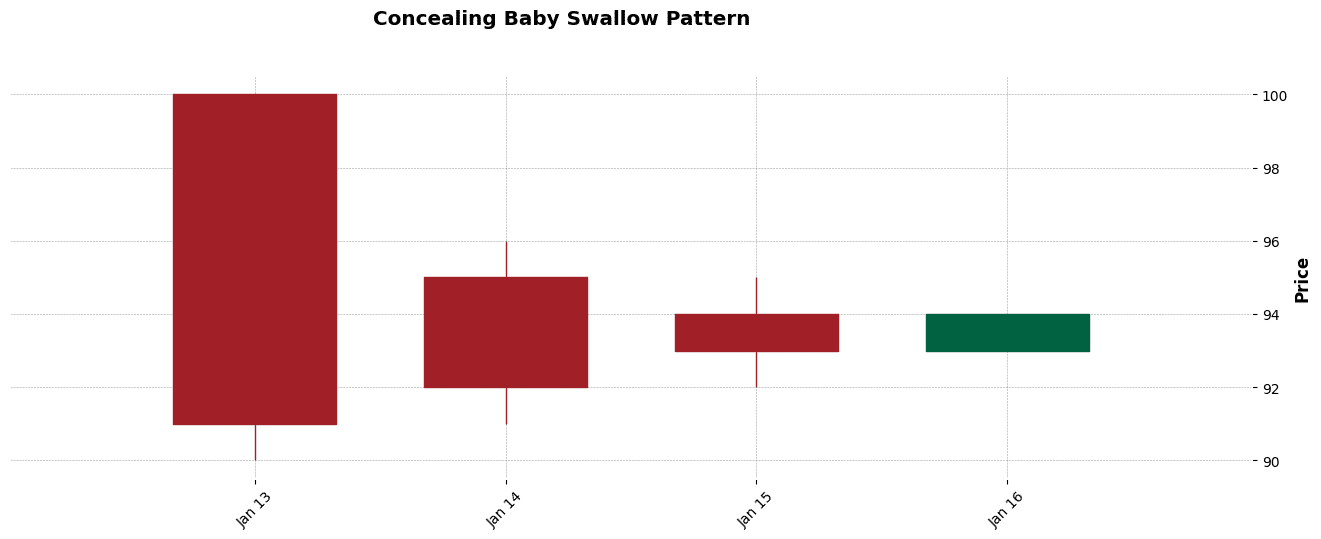
Figure. 14: Concealing Baby Swallow Candlestick Pattern Example
3.14 Counterattack
The Counterattack pattern is a two-day reversal pattern that occurs in a trend.
It is characterized by a long candle followed by a candle of the opposite color, which opens at a new high (in a downtrend) or low (in an uptrend) but closes near the close of the previous day.
This pattern signifies that the momentum of the current trend is stalling, and a reversal may be imminent.
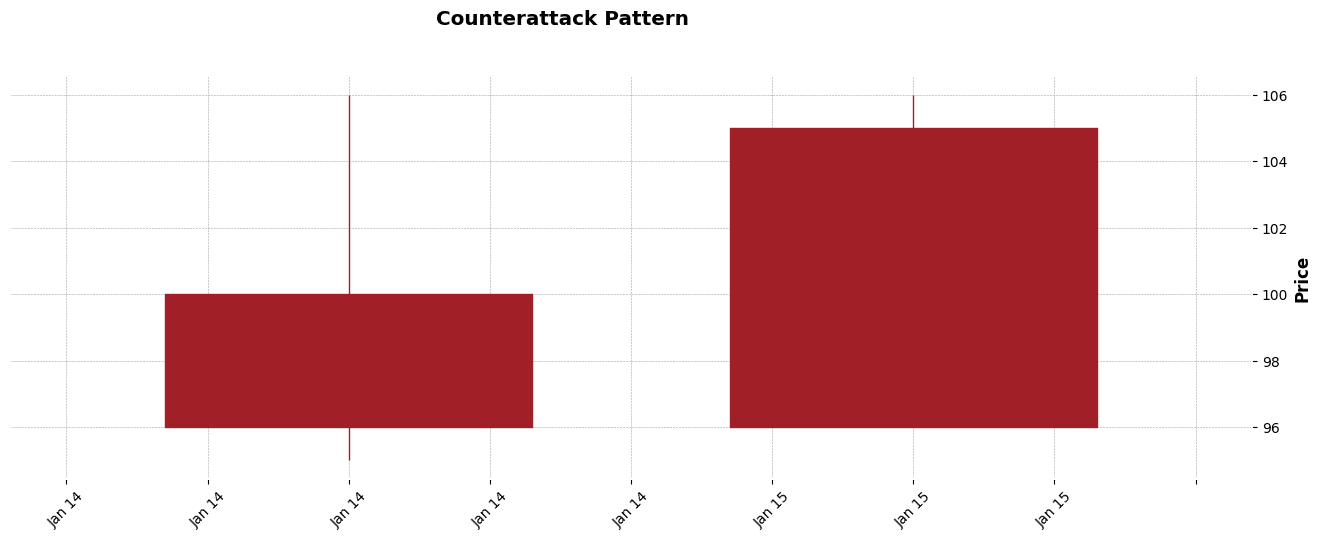
Figure. 15: Counterattack Candlestick Pattern Example.
3.15 Dark Cloud Cover
The Dark Cloud Cover is a bearish reversal pattern that appears at the top of an uptrend. It is characterized by a large green (or white) candle followed by a large red (or black) candle.
The red candle opens higher than the previous day’s high and closes below the midpoint of the body of the first candle, suggesting a shift from bullish to bearish sentiment.
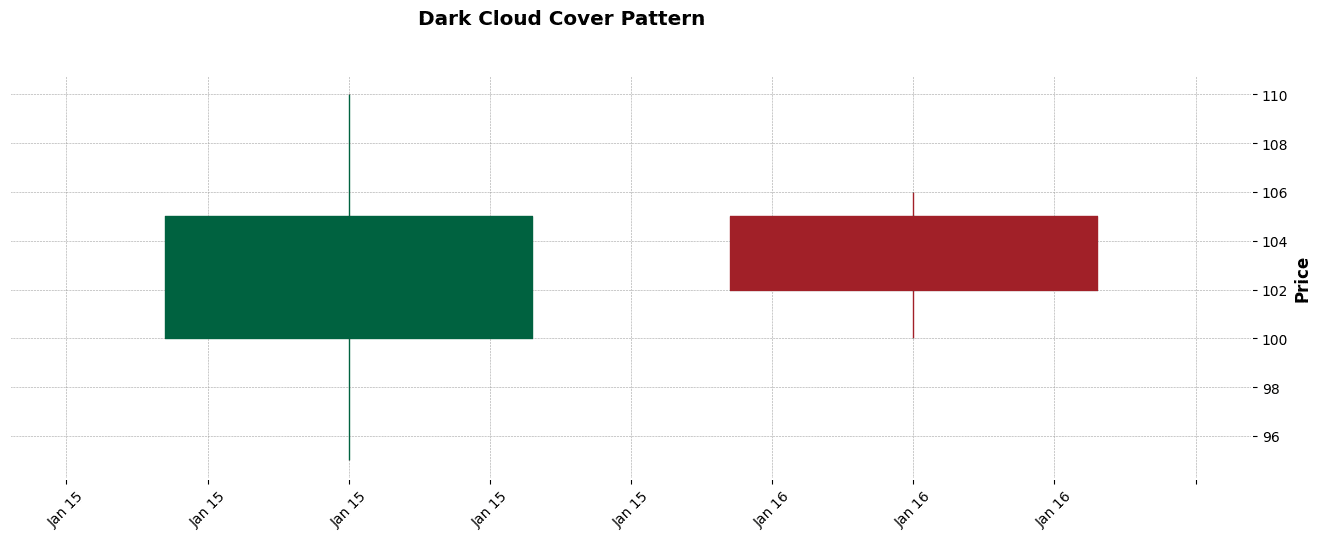
Figure. 16: Dark Cloud Cover Candlestick Pattern Example
3.16 Doji
The Doji is one of the most well-known candlestick patterns, signaling indecision in the market. It is characterized by a candle where the opening and closing prices are nearly identical.
Furthermore, the length of the shadows can vary. A Doji after an extended trend may indicate a potential reversal. Its significance increases when it forms part of other patterns like the Morning Star, Evening Star, or Doji Star.
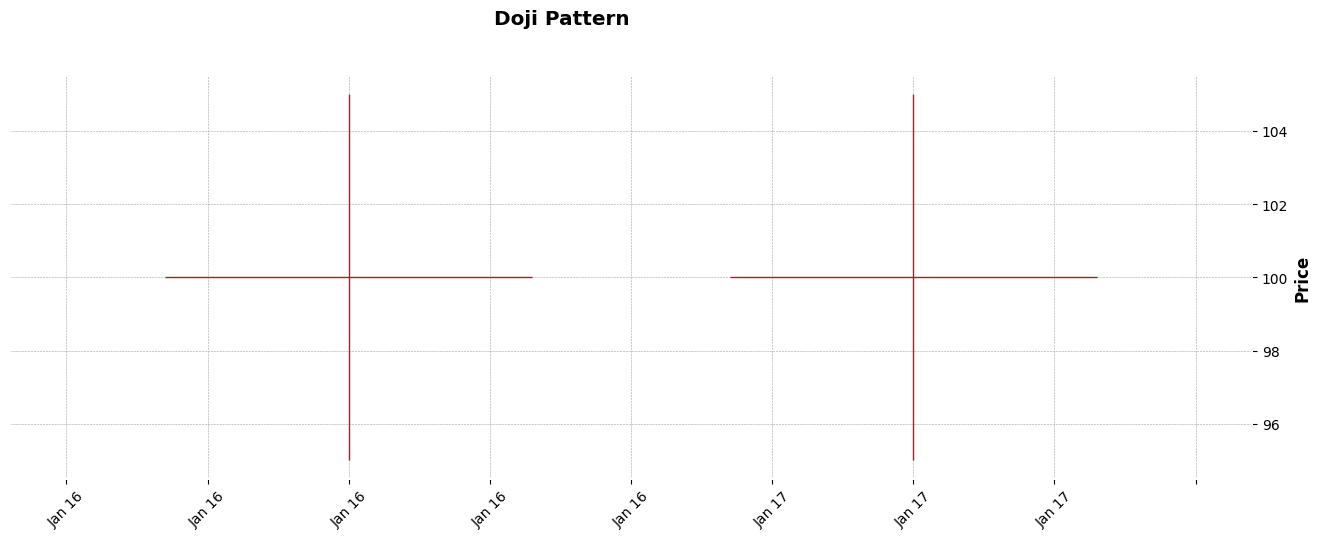
Figure. 17: Doji Candlestick Pattern Example
3.17 Doji Star
The Doji Star is a pattern that signals indecision in the market, often appearing at the top or bottom of a trend. It is formed by a Doji (a candle with a small or no body) that gaps away from the previous candle.
In an uptrend, a Doji Star can signal a potential bearish reversal, while in a downtrend, it may indicate a bullish reversal. The gap between the Doji and the previous candle is key to this pattern’s significance.
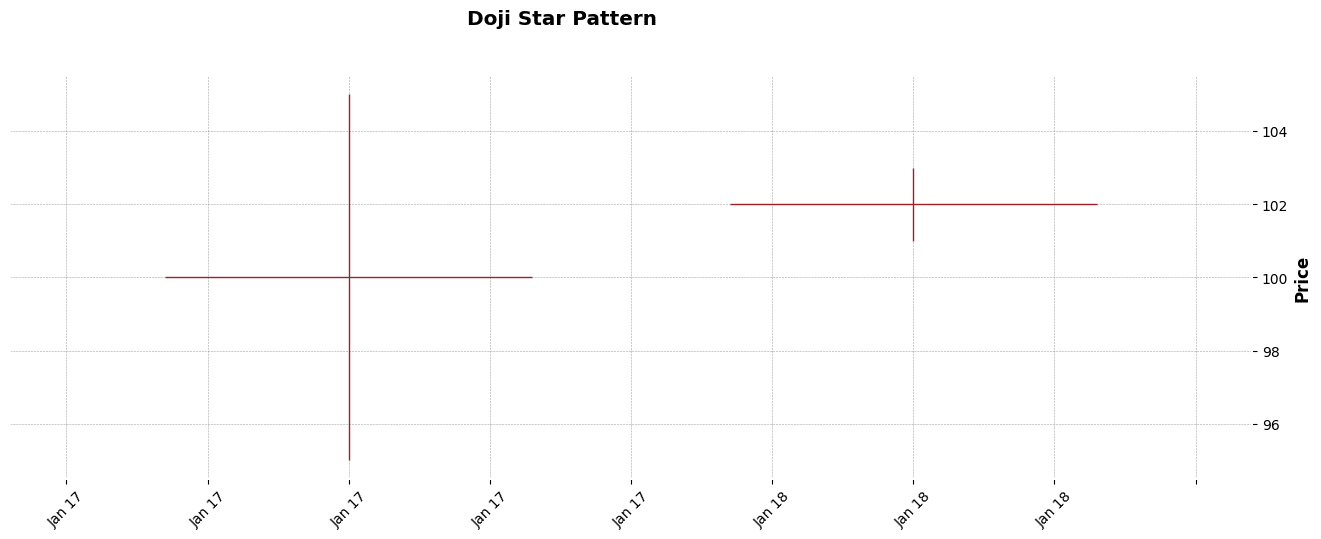
Figure. 18: Doji Star Candlestick Pattern Example.
3.18 Dragonfly Doji
The Dragonfly Doji is a type of Doji where the open, high, and close prices are at the same level, but there is a long lower shadow.
This pattern is typically seen at the bottom of downtrends and can signal a potential bullish reversal.
The long lower shadow indicates that sellers pushed the price down, but buyers were able to overcome this selling pressure and close the price near the open.
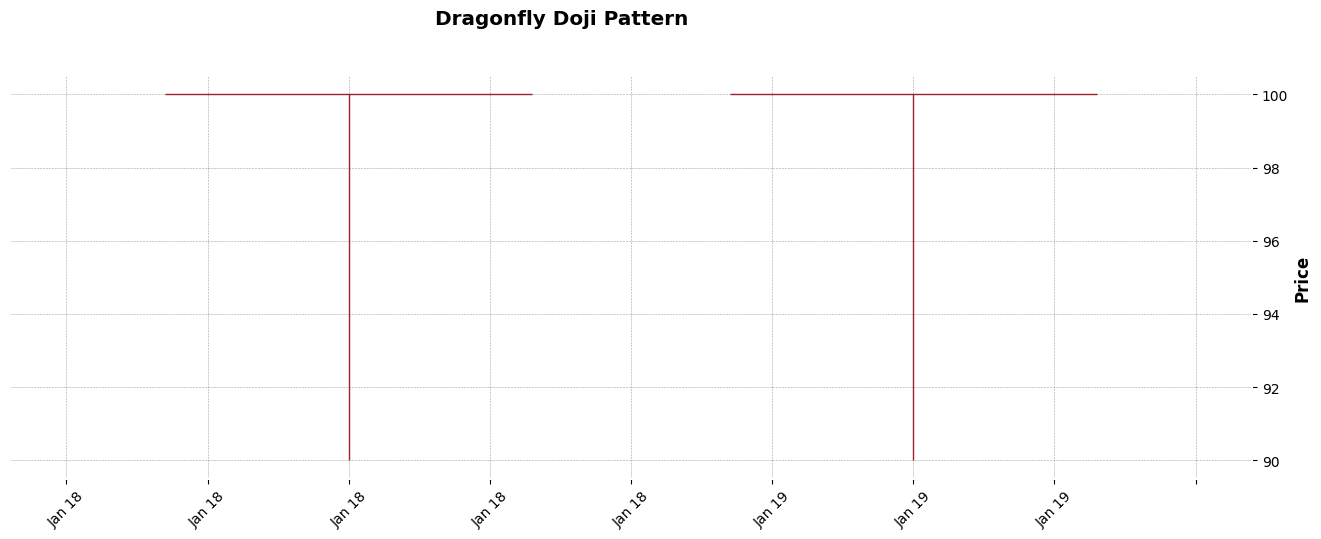
Figure. 19: Dragonfly Doji Candlestick Pattern Example
3.19 Engulfing Pattern
The Engulfing Pattern is a major reversal pattern comprised of two opposite colored bodies. The second candle’s body completely engulfs the first candle’s body.
In a downtrend, a bullish engulfing pattern (where a large green candle engulfs a small red candle) signals a potential reversal. Conversely, in an uptrend, a bearish engulfing pattern (a large red candle engulfing a small green candle) indicates potential reversal to the downside.
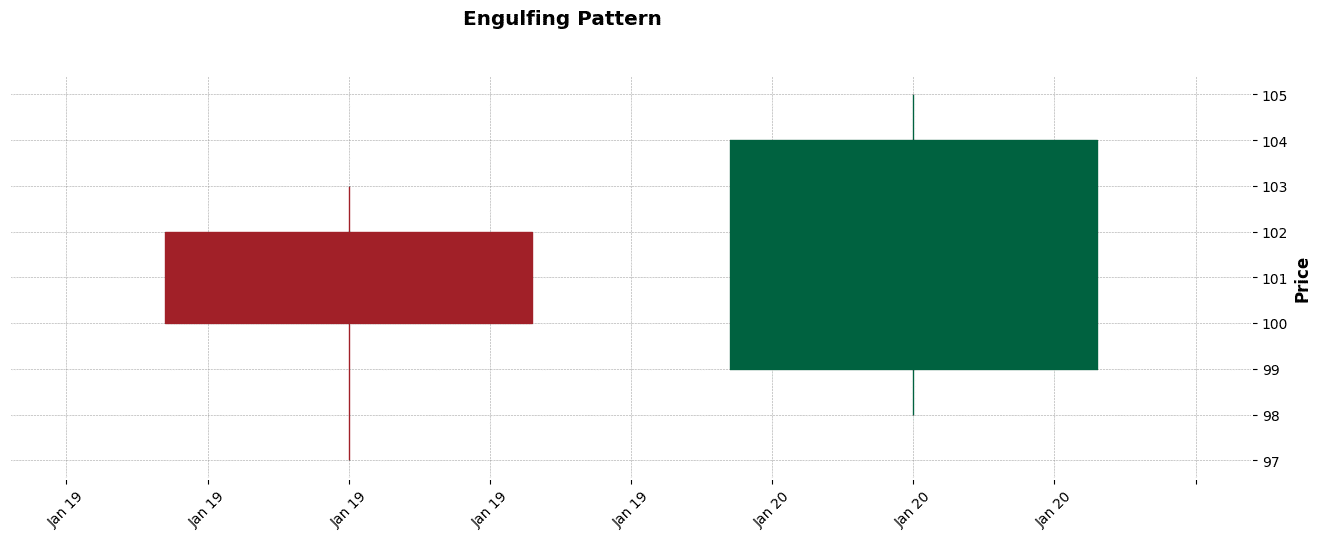
Figure. 20: Engulfing Pattern Candlestick Pattern Example
3.20 Evening Doji Star
The Evening Doji Star is a bearish reversal pattern that occurs at the top of an uptrend. It is a three-candle pattern starting with a large green candle, followed by a Doji that gaps above the first candle, and concludes with a red candle that opens below the Doji and closes into the body of the first candle. This pattern indicates a shift from bullish to bearish sentiment.
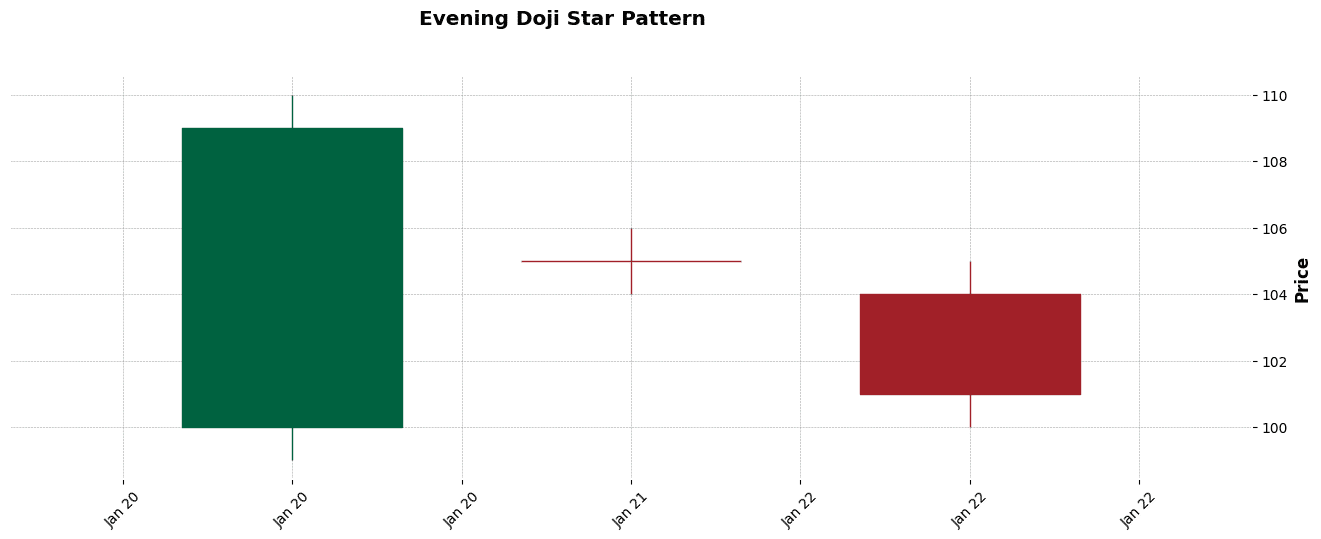
Figure. 21: Evening Star Candlestick Pattern Example.
3.21 Evening Star
The Evening Star is a bearish reversal pattern occurring at the top of an uptrend. It is a three-candle pattern consisting of a large green candle, followed by a small-bodied candle that gaps above the first candle, and a third red candle that closes well into the body of the first candle. This pattern signals a shift in momentum from buyers to sellers.

Figure. 22: Up/Down-gap side-by-side white lines Candlestick Pattern Example
3.22 Up/Down-gap side-by-side white lines
The Up/Down-gap Side-by-side White Lines pattern is a continuation pattern that occurs during an uptrend (Up-gap) or a downtrend (Down-gap).
Moreover, it consists of two large green candles with a gap between them. In an uptrend, the second candle opens higher than the first, while in a downtrend, it opens lower. This pattern indicates a strong market trend continuation.
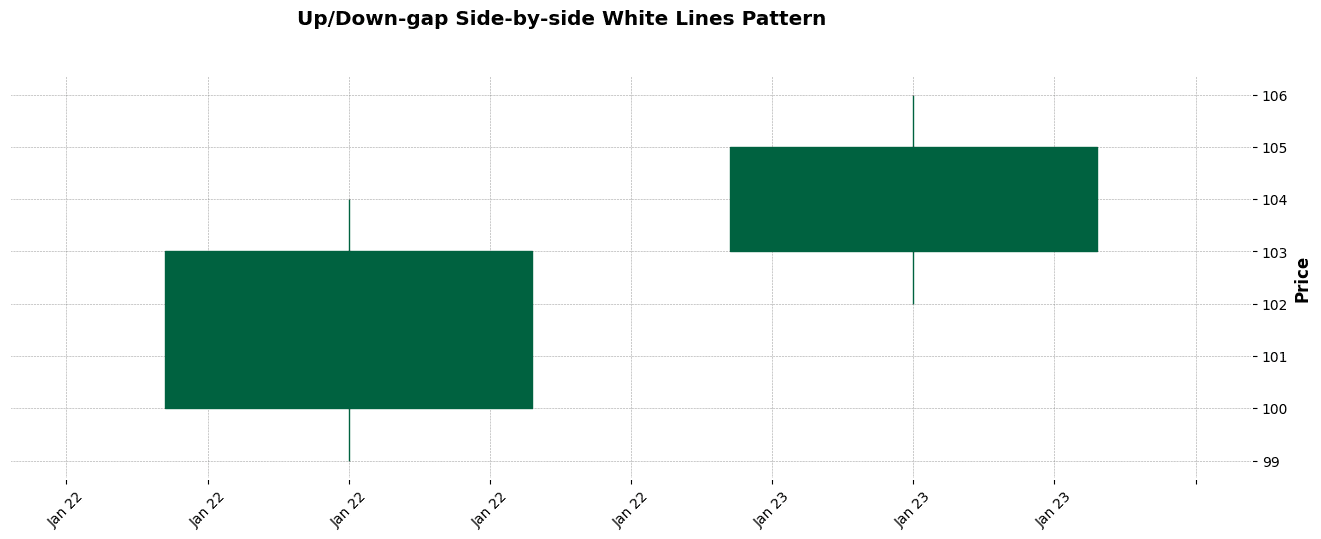
Figure. 23: Gravestone Doji Candlestick Pattern Example.
3.23 Gravestone Doji
The Gravestone Doji is a bearish reversal pattern that appears after an uptrend.
It has a long upper shadow and no lower shadow, with the open, low, and close prices at or near the low of the session.
This pattern suggests that buyers pushed prices up, but sellers managed to push them back down, signaling a potential trend reversal.
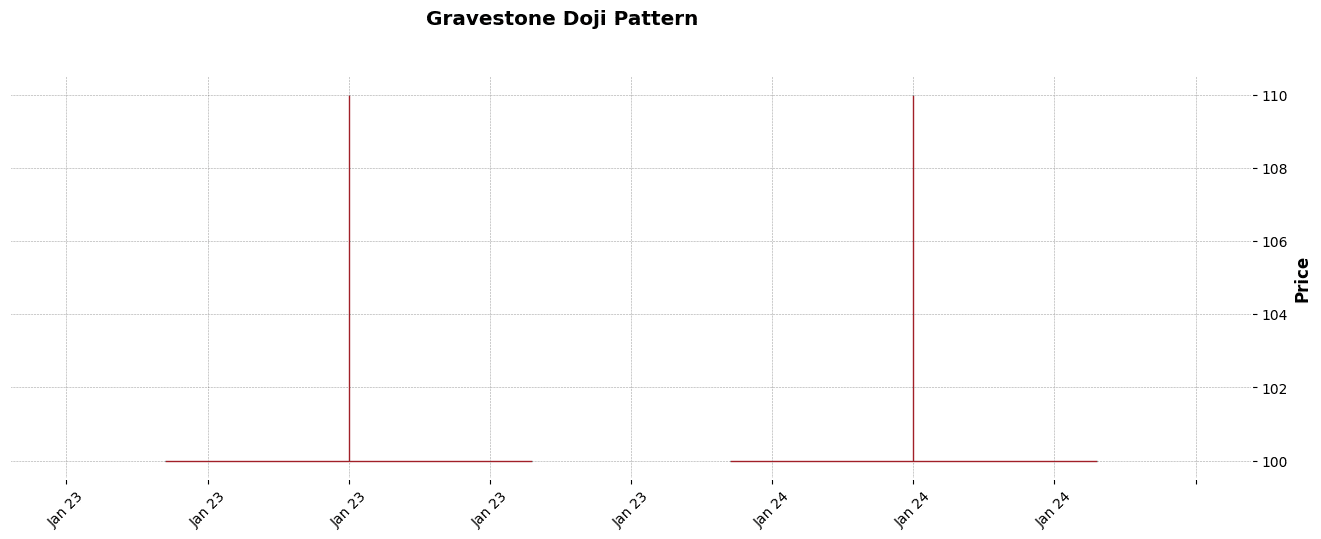
Figure. 24: Gravestone Doji Candlestick Pattern Example.
3.24 Hammer
The Hammer is a bullish reversal pattern that forms during a downtrend. It is characterized by a small body at the top and a long lower shadow (at least twice the size of the body) with little or no upper shadow.
The Hammer indicates that despite strong selling pressure during the session, buyers managed to push the price back up close to the open, suggesting a potential shift in momentum.
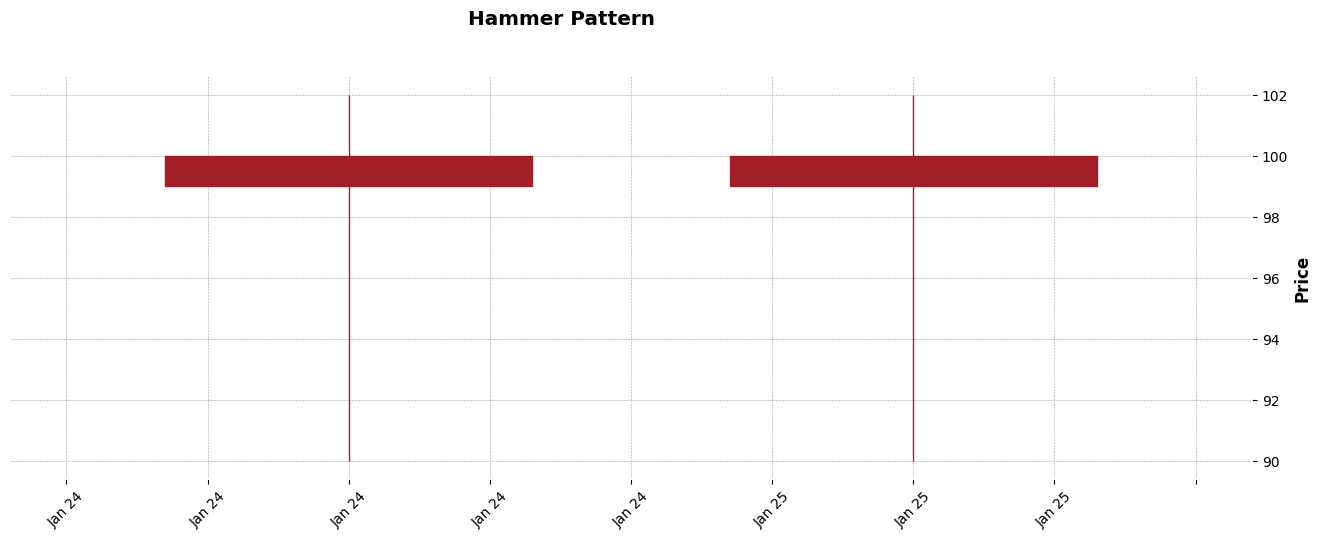
Figure. 25: Hanging Man Candlestick Pattern Example.
3.25 Hanging Man
The Hanging Man is a bearish reversal pattern that appears at the top of an uptrend. It resembles the Hammer pattern but occurs in a different context.
The Hanging Man has a small body at the upper end and a long lower shadow. It indicates that, despite a significant sell-off during the day, buyers pushed the prices back up, but the selling pressure might still be strong, signaling a potential trend reversal.
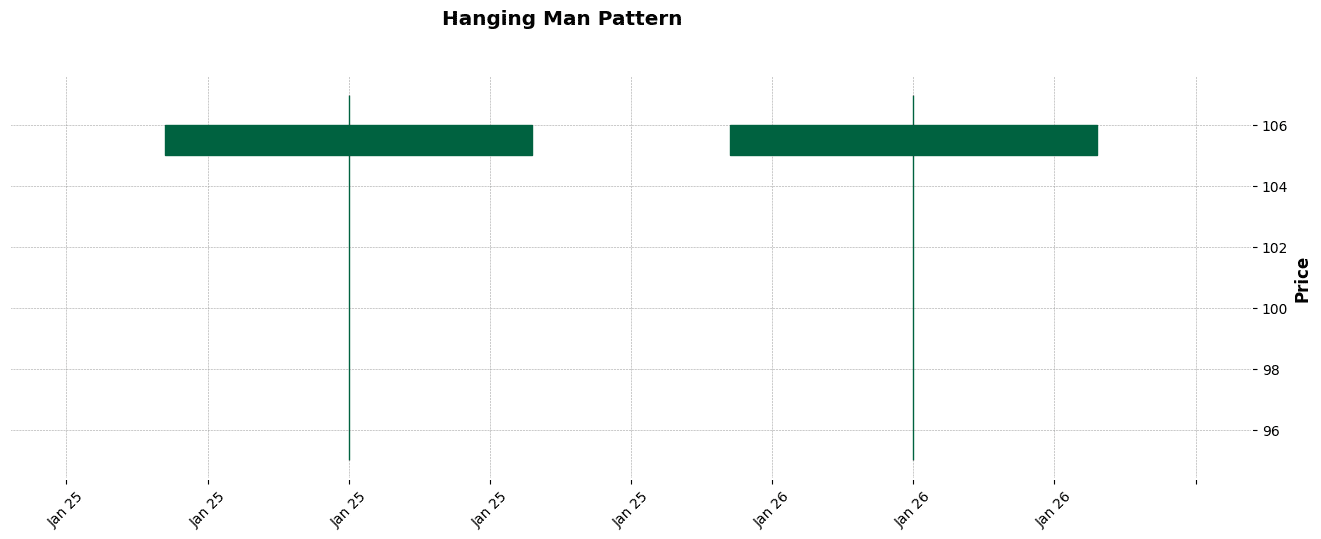
Figure. 26: Hanging Man Candlestick Pattern Example
3.26 Harami Pattern
The Harami Pattern is a potential reversal pattern that consists of a large candle followed by a smaller candle that lies within the range of the larger candle’s body.
A bullish Harami occurs in a downtrend and signifies a decrease in bearish momentum. Conversely, a bearish Harami appears in an uptrend, indicating weakening bullish momentum.
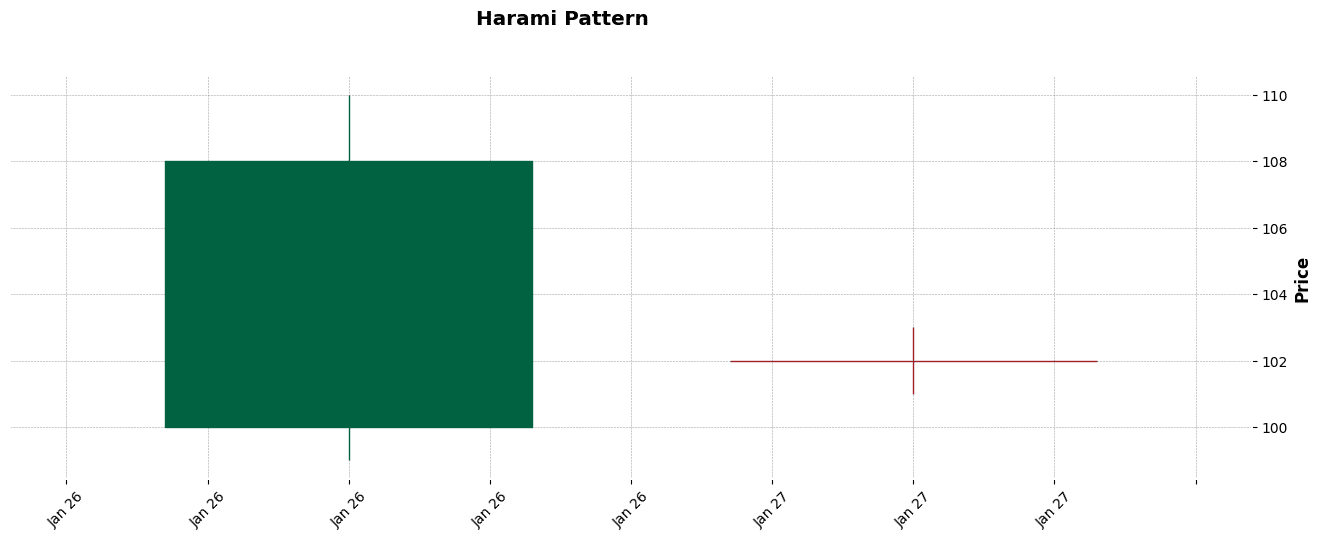
Figure. 27: Harami Pattern Candlestick Pattern Example
3.27 Harami Cross
The Harami Cross is a variation of the Harami pattern and is considered a stronger signal.
It consists of a large candle followed by a Doji, which is completely within the range of the prior candle’s body.
This pattern indicates a strong indecision in the market and can be a precursor to a potential trend reversal.
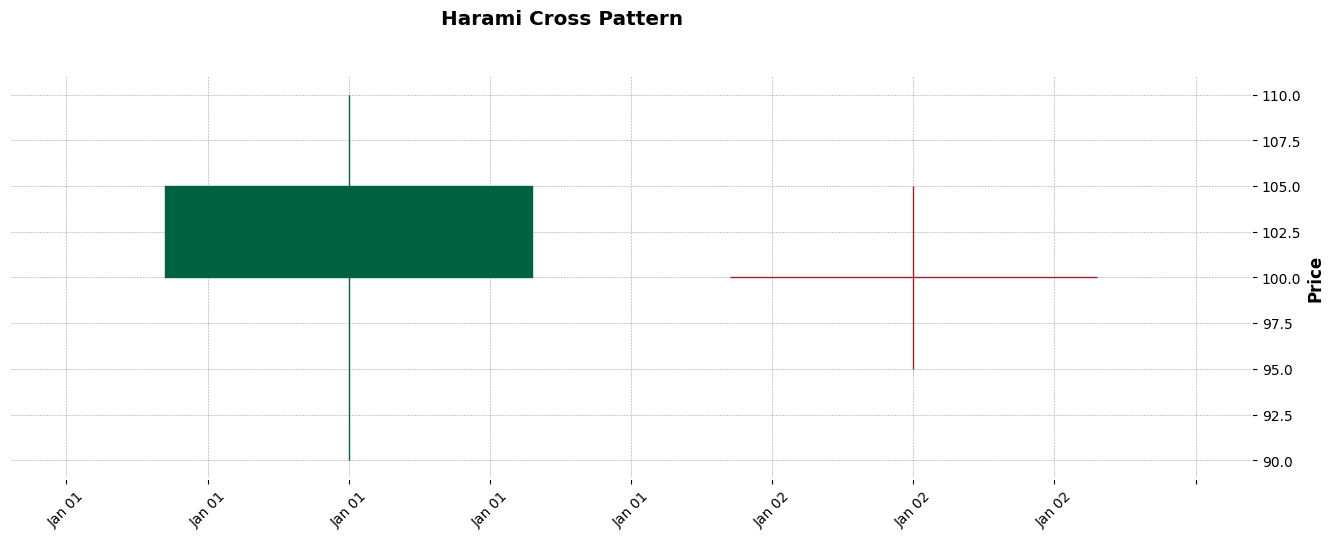
Figure. 28: Harami CrossCandlestick Pattern Example
3.28 High-Wave Candle
The High-Wave Candle is a pattern characterized by a long upper and lower shadow with a small body, reflecting significant indecision and volatility in the market.
It indicates a state of flux in the market, with neither buyers nor sellers gaining control. These candles can appear in both uptrends and downtrends and are often seen as a sign of a potential change in market sentiment.
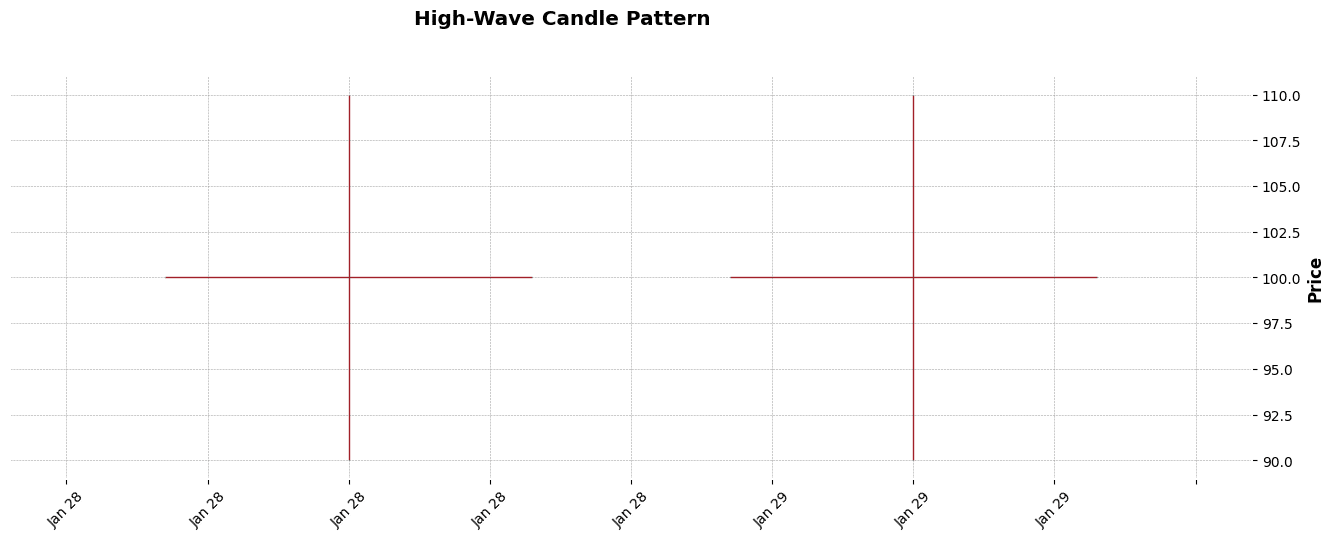
Figure. 29: High-Wave Candle Candlestick Pattern Example.
3.29 Hikkake
The Hikkake Pattern is a pattern used to identify potential reversals or continuations in the market.
It begins with a bar that sets a high or low (the setup bar), followed by a bar that moves in the opposite direction (the trigger bar).
The pattern is confirmed when the price moves back past the setup bar, indicating a potential trade opportunity in the direction of the breakout.
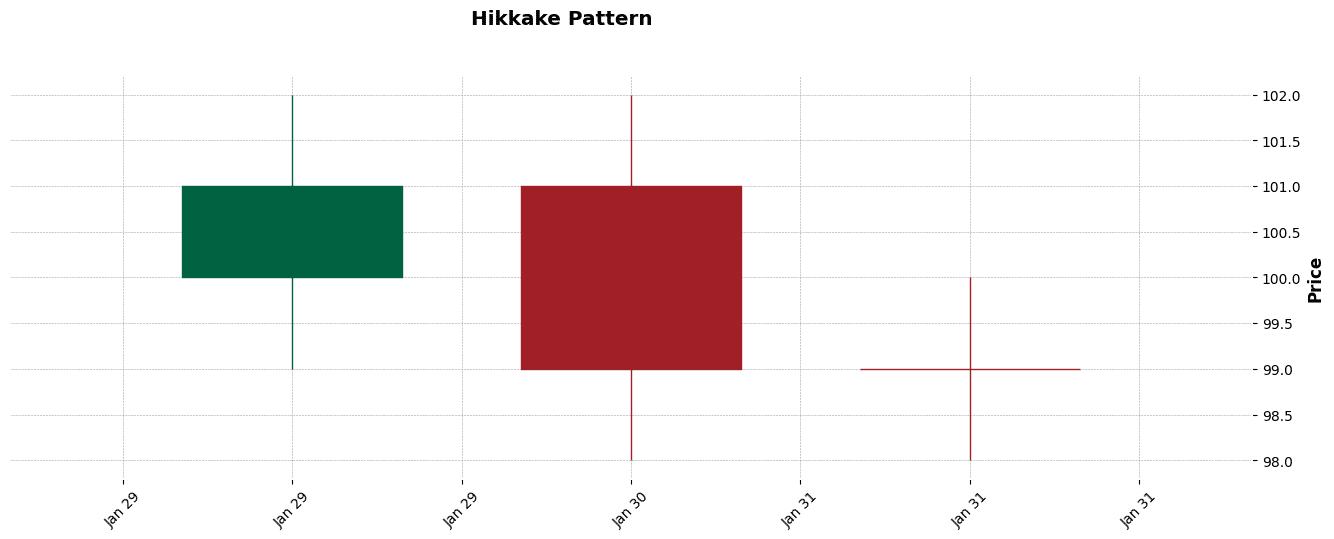
Figure. 30: Hikkake Candlestick Pattern Example.
3.30 Modified Hikkake
The Modified Hikkake Pattern is a variation of the Hikkake that includes additional criteria for the setup and trigger bars, offering a more filtered approach.
This pattern is often considered to be more reliable than the standard Hikkake and can be used to identify both bullish and bearish market movements.

Figure. 31: Modified Hikkake Candlestick Pattern Example
3.31 Homing Pigeon
The Homing Pigeon is a bullish reversal pattern found in a downtrend. It’s a two-candlestick pattern where the first candle is a long black (or red) candle, followed by a smaller black candle that’s contained within the range of the first candle’s body. This pattern suggests a softening of the bearish sentiment and could indicate an upcoming bullish reversal.

Figure. 32: Homing Pigeon Candlestick Pattern Example
3.32 Identical Three Crows
The Identical Three Crows is a bearish reversal pattern appearing in an uptrend. It consists of three long, black (or red) candles with small or no wicks.
Each candle opens at the same level as the previous candle’s close, suggesting a strong bearish sentiment. This pattern indicates a possible end to the uptrend and a shift towards a downtrend.
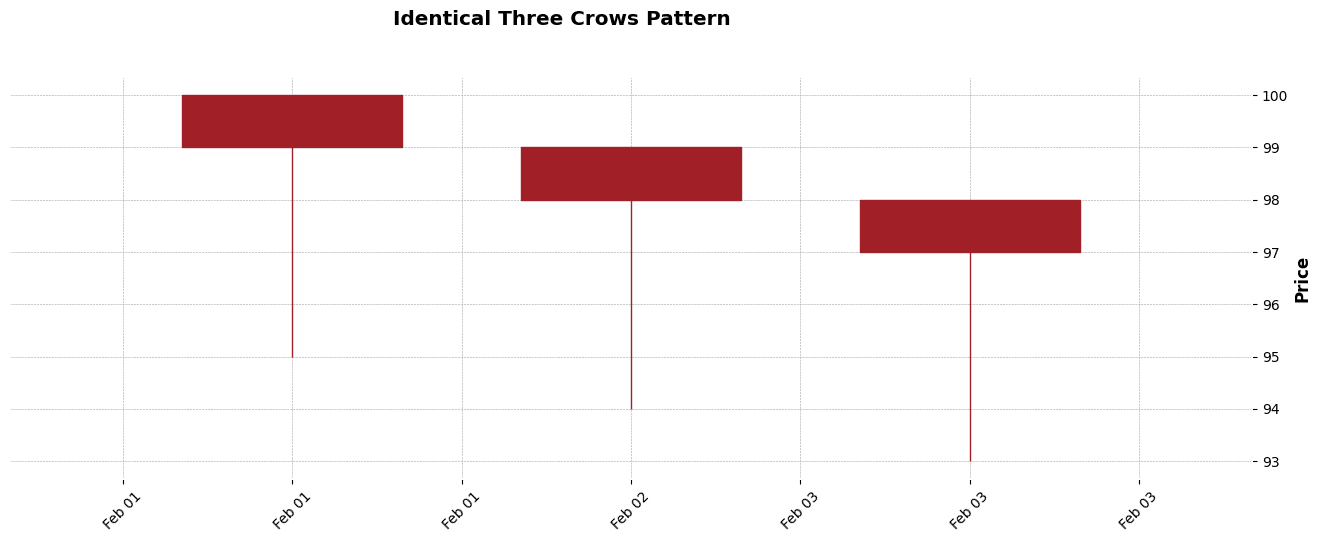
Figure. 33: Identical Three Crows Candlestick Pattern Example.
3.33 In-Neck
The In-Neck Pattern is a bearish continuation pattern that appears in a downtrend. It consists of two candles: the first is a long black (or red) candle, followed by a smaller white (or green) candle.
Moreover, the second candle opens lower but closes near the close of the first candle, indicating that the bearish trend is likely to continue.
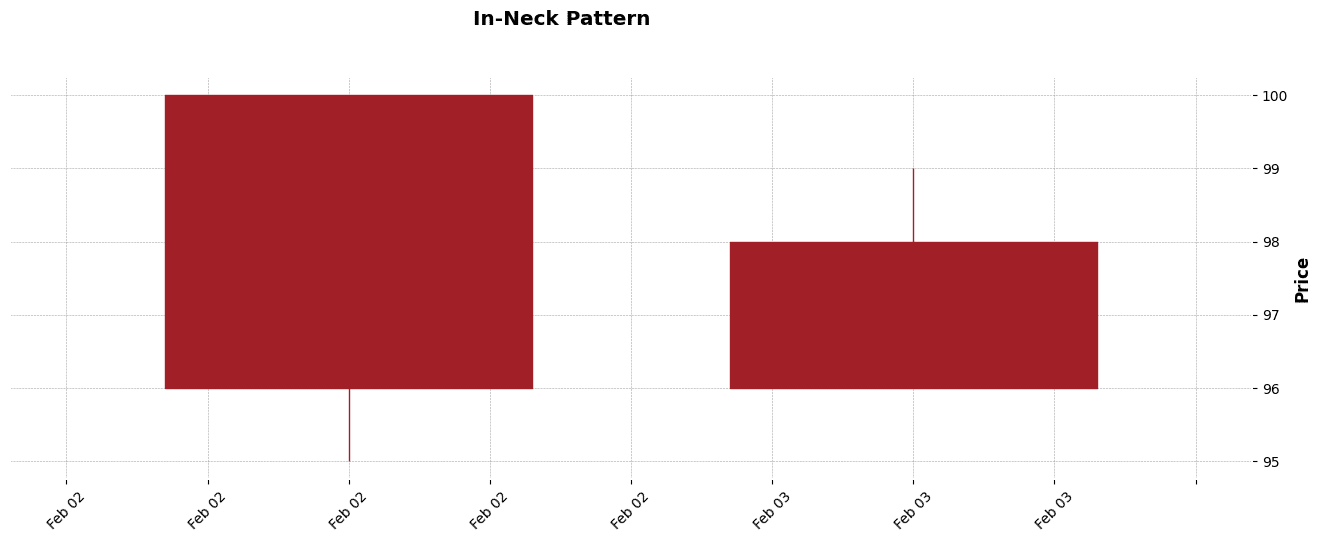
Figure. 34: In-Neck Candlestick Pattern Example.
3.34 Inverted Hammer
The Inverted Hammer is a bullish reversal pattern that occurs at the bottom of a downtrend. It features a small body at the lower end of the trading range with a long upper shadow and little or no lower shadow.
This pattern suggests that buyers attempted to push the price up, but sellers resisted. A bullish confirmation is needed to confirm a reversal.

Figure. 35: Inverted Hammer Candlestick Pattern Example.
3.35 Kicking
The Kicking pattern is a two-candlestick pattern signaling a strong reversal. It consists of a Marubozu candle (a candle with no shadows) followed by another Marubozu of the opposite color.
The bullish Kicking pattern starts with a bearish Marubozu and is followed by a bullish Marubozu. The bearish variant is the opposite. This pattern indicates a sudden and strong shift in market sentiment.
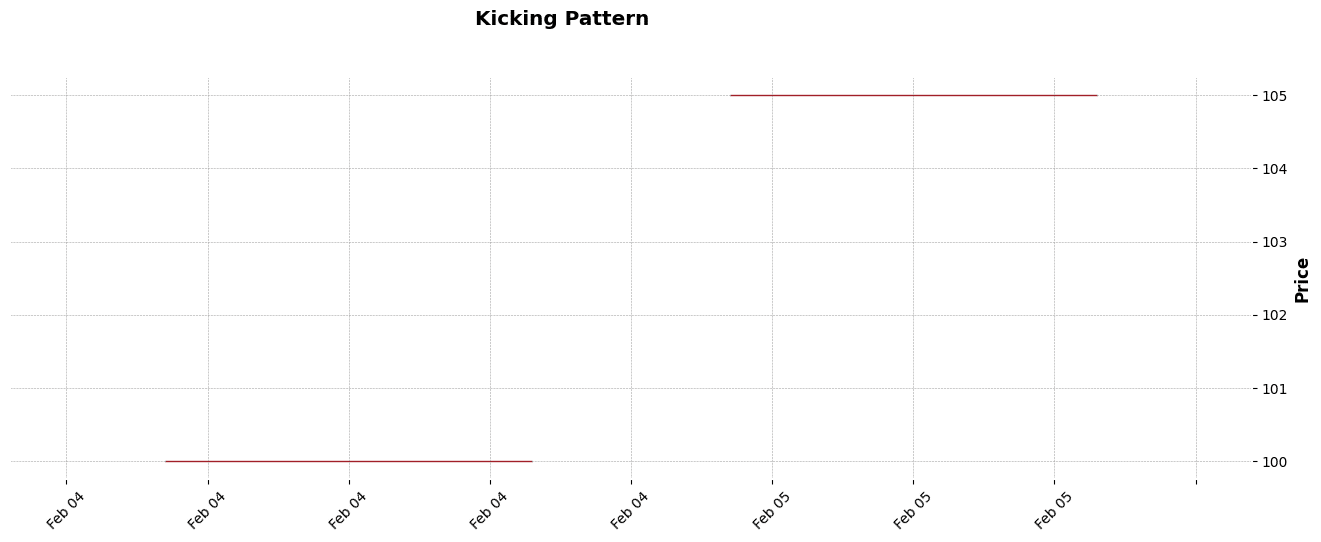
Figure. 36: Kicking Candlestick Pattern Example
3.36 Kicking — bull/bear determined by the longer marubozu
This variant of the Kicking pattern is determined by the length of the Marubozu candles. The pattern consists of two opposite-colored Marubozu candles.
The key to this pattern is the length of the candles — the longer Marubozu determines the direction of the reversal. A longer bullish Marubozu suggests a stronger bullish reversal, and vice versa for a bearish reversal.
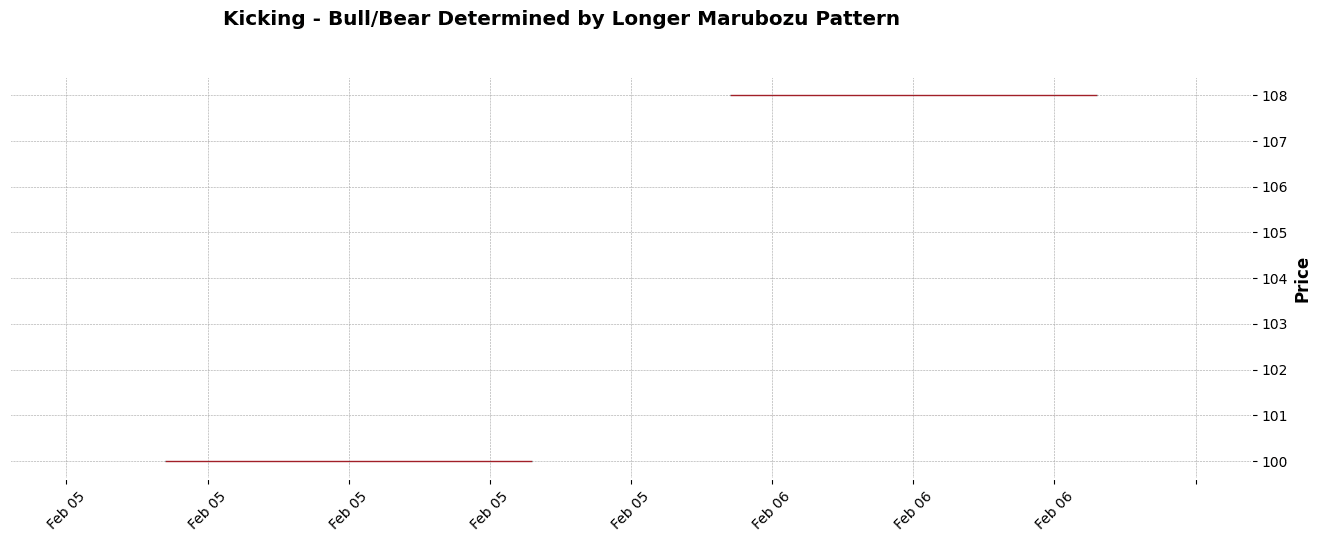
Figure. 37: Kicking - bull/bear determined by the longer marubozu Candlestick Pattern Example
3.37 Ladder Bottom
The Ladder Bottom is a bullish reversal pattern that typically forms at the end of a downtrend. It consists of five candles, with the first three being long black (or red) candles, each closing lower than the previous.
The fourth candle opens within the body of the third candle but closes higher, and the fifth candle is a long white (or green) candle that confirms the bullish reversal.
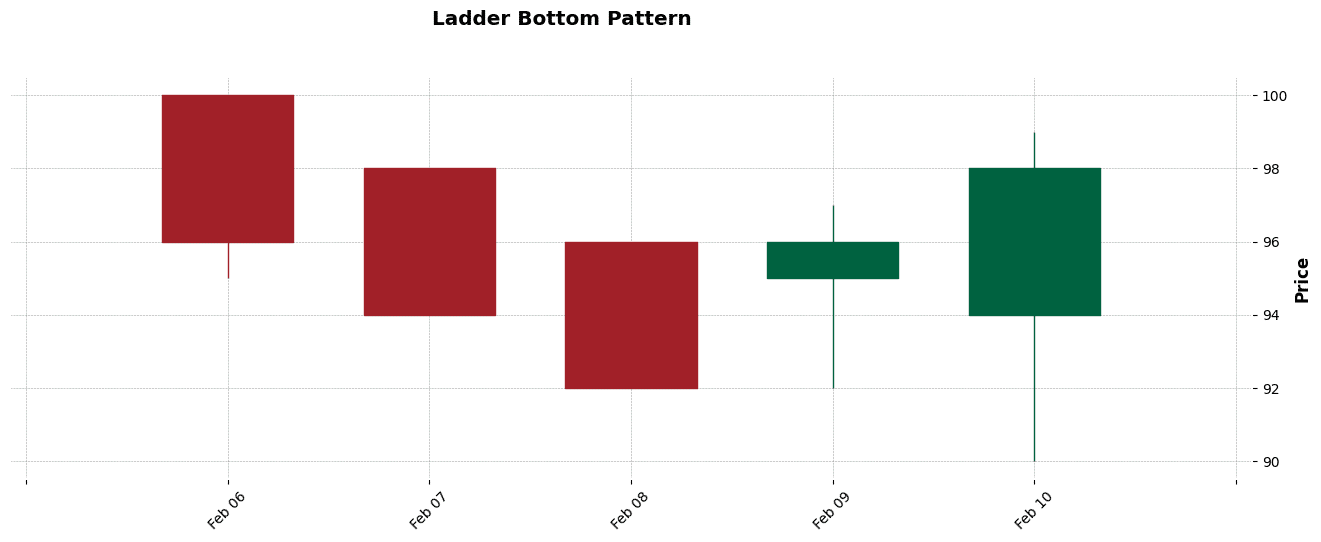
Figure. 38: Kicking - bull/bear determined by the longer marubozu Candlestick Pattern Example
3.38 Long Legged Doji
The Long Legged Doji is a candlestick pattern that represents significant indecision in the market. It is characterized by a long upper and lower shadow with a small body in the middle.
Moreover, this pattern indicates that neither the bulls nor the bears could gain control during the trading session, suggesting a turning point or a continuation of the current trend.
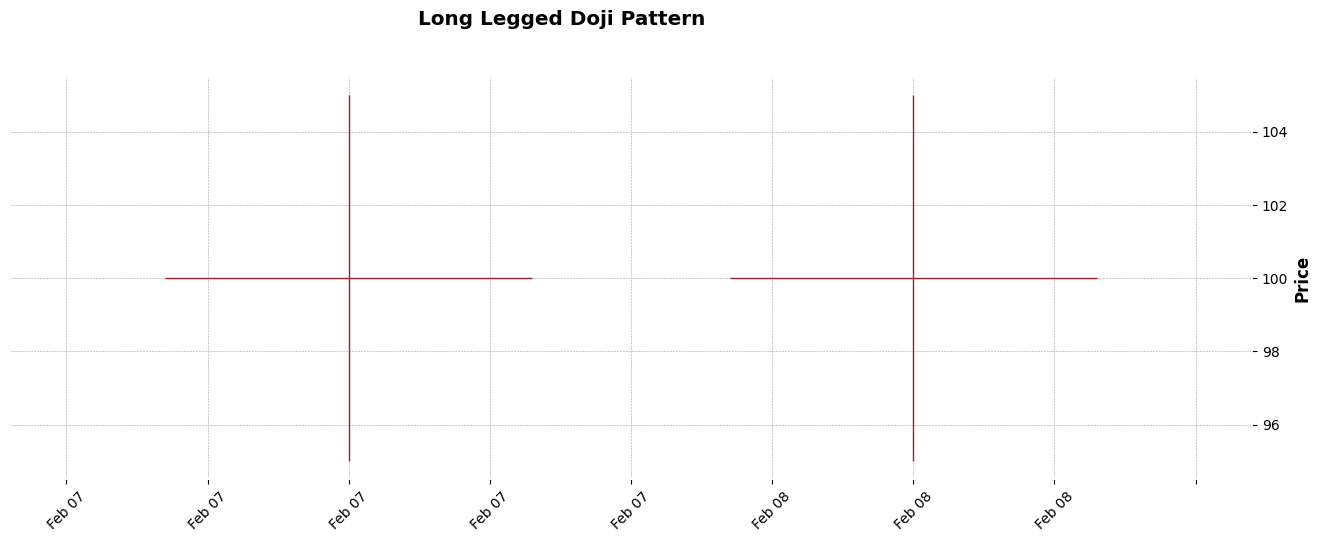
Figure. 39: Long Legged Doji Candlestick Pattern Example
3.39 Long Line Candle
The Long Line Candle is a simple yet significant pattern indicating strong buying or selling pressure. It is characterized by a long body with little or no shadows.
A long white (or green) candle signifies strong buying pressure, while a long black (or red) candle indicates strong selling pressure. This pattern is essential in understanding market sentiment and momentum.
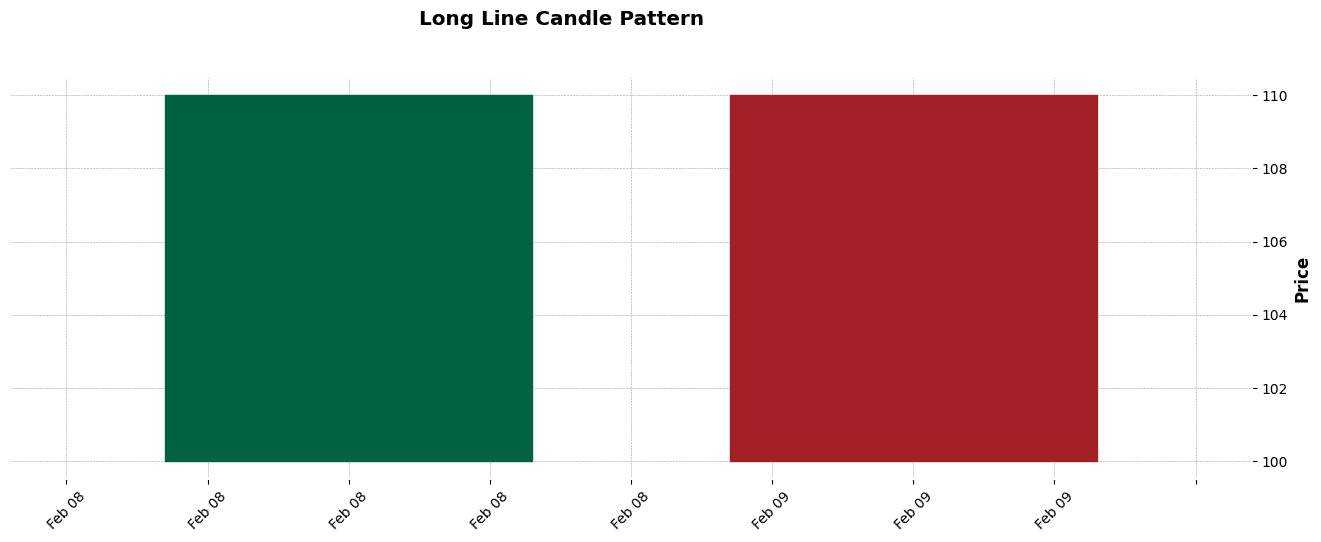
Figure. 40: Long Line Candle Candlestick Pattern Example.
3.40 Marubozu
The Marubozu is a powerful single candle pattern with a full body and no shadows. A White (or Green) Marubozu indicates a strong bullish sentiment, with the candle opening at its low and closing at its high.
Conversely, a Black (or Red) Marubozu suggests a bearish sentiment, where the candle opens at its high and closes at its low. This pattern highlights dominance by either buyers or sellers.
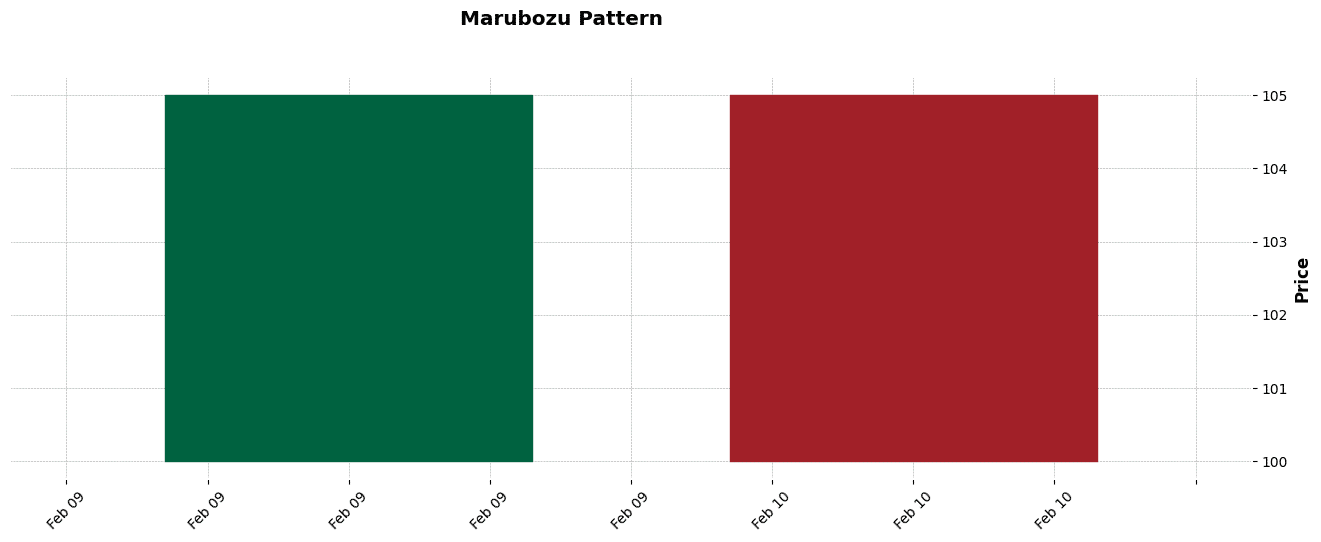
Figure. 41: Marubozu Candlestick Pattern Example.
3.41 Matching Low
The Matching Low is a bullish reversal pattern found at the bottom of a downtrend. It consists of two black (or red) candles with the same closing price.
The first candle is a long black candle, while the second is typically smaller. The identical closing prices indicate a potential exhaustion of the downtrend and a possible shift to an uptrend.

Figure. 42: Matching Low Candlestick Pattern Example.
3.42 Mat Hold
The Mat Hold pattern is a bullish continuation pattern that appears in an uptrend. It begins with a long white (or green) candle, followed by three small black (or red) candles that stay within the range of the first candle, and concludes with another long white candle. This pattern suggests that the uptrend is likely to continue.

Figure. 43: Mat Hold Candlestick Pattern Example.
3.43 Morning Doji Star
The Morning Doji Star is a bullish reversal pattern that occurs at the bottom of a downtrend. It is a three-candle pattern, starting with a long black (or red) candle, followed by a Doji that gaps below the first candle, and concluded by a white (or green) candle that closes well into the first candle’s body. This pattern indicates a shift from bearish to bullish sentiment.
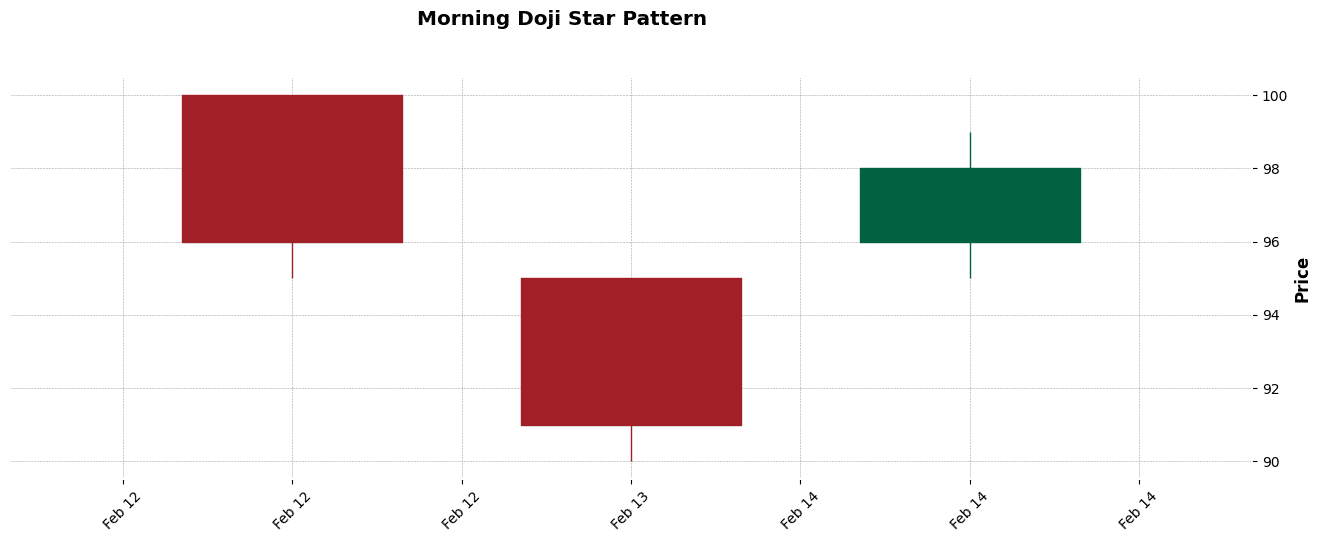
Figure. 44: Morning Doji Star Candlestick Pattern Example.
3.44 Morning Star
The Morning Star is a bullish reversal pattern similar to the Morning Doji Star. It is a three-candle pattern found at the bottom of a downtrend. The pattern consists of a long black candle, followed by a small-bodied candle that gaps down, and a long white candle that closes above the midpoint of the first candle. This pattern indicates a potential reversal from bearish to bullish.

Figure. 45: Morning Star Candlestick Pattern Example.
3.45 On-Neck
The On-Neck Pattern is a bearish continuation pattern that occurs during a downtrend. It consists of two candles: a long black (or red) candle followed by a smaller white (or green) candle. The second candle opens lower but closes near the low of the previous candle, indicating that the downtrend is likely to continue.
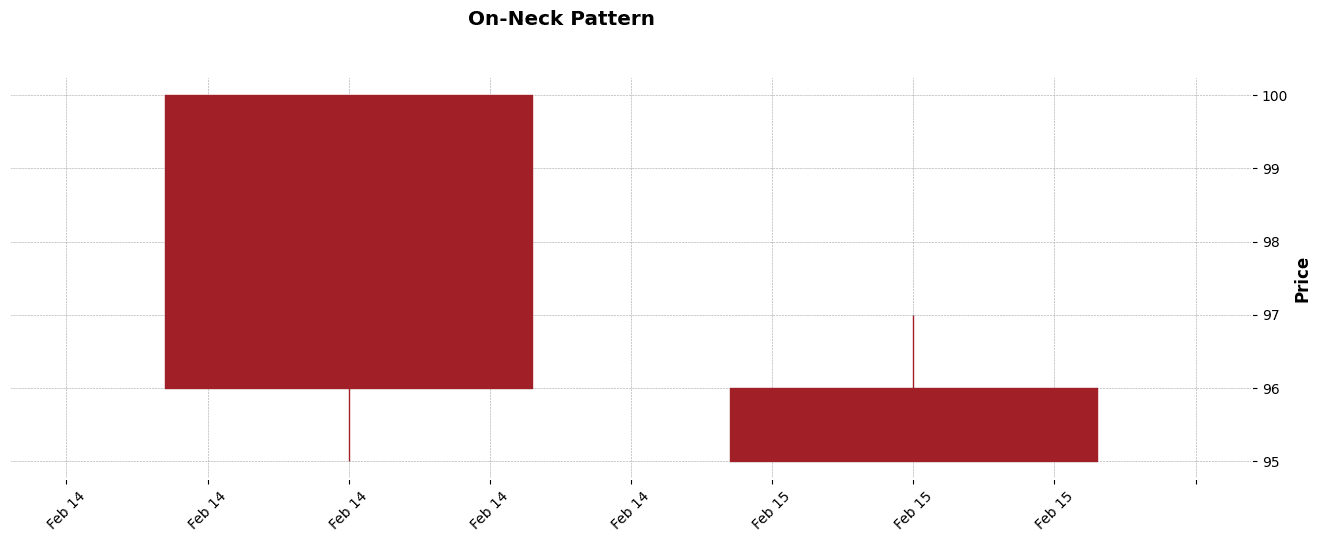
Figure. 46: Piercing Candlestick Pattern Example.
3.46 Piercing
The Piercing Pattern is a bullish reversal pattern found at the bottom of a downtrend. It is a two-candlestick pattern where the first candle is a long black (or red) candle, followed by a long white (or green) candle. The second candle opens lower but closes above the midpoint of the body of the first candle, indicating a potential reversal to an uptrend.
Figure. 47: Rickshaw Man Candlestick Pattern Example.
3.47 Rickshaw Man
The Rickshaw Man is a Doji pattern that indicates extreme indecision in the market. It has a long upper and lower shadow with the open and close prices situated around the middle of the day’s trading range. This pattern suggests that neither buyers nor sellers could gain the upper hand, and a directionless market.
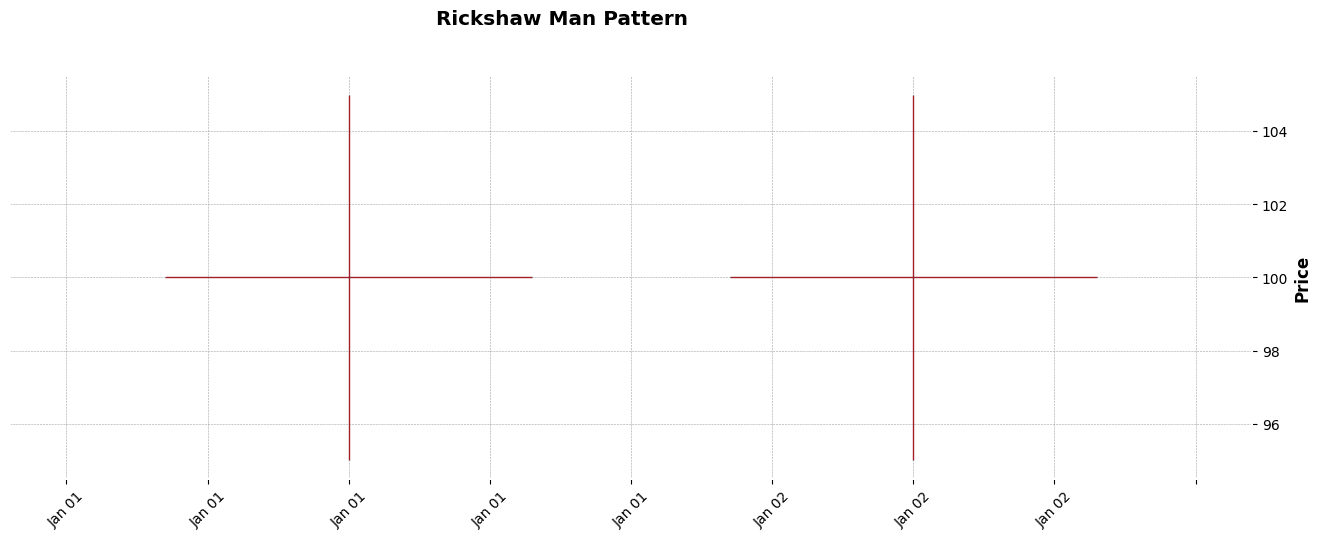
Figure. 48: Rising/Falling Three Methods Candlestick Pattern Example
3.48 Rising/Falling Three Methods
The Rising/Falling Three Methods pattern is a continuation pattern observed in a trending market.
The Rising Three Methods occur in an uptrend and consist of a long white candle, followed by three small black candles within the range of the first candle, and another long white candle to complete the pattern.
Furthermore, the Falling Three Methods is its bearish counterpart in a downtrend, with the colors reversed. These patterns indicate the continuation of the existing trend.

Figure. 49: Rising/Falling Three Methods Candlestick Pattern Example
3.49 Separating Lines
The Separating Lines pattern is a trend continuation pattern. In an uptrend, it consists of a long black (or red) candle followed by a long white (or green) candle that opens at the same price as the previous candle’s open.
In a downtrend, the colors are reversed. This pattern indicates that the current trend, whether bullish or bearish, is likely to continue.
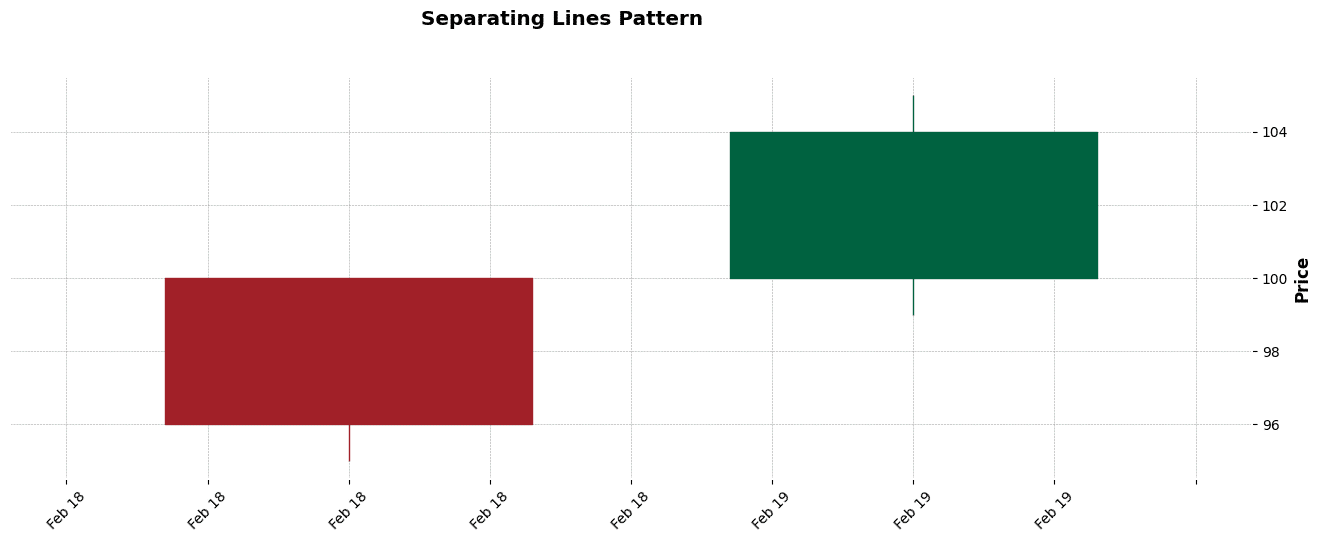
Figure. 50: Separating Lines Candlestick Pattern Example.
3.50 Shooting Star
The Shooting Star is a bearish reversal pattern that appears after an uptrend. It looks like an inverted hammer but forms at the top of an uptrend.
Furthermore, the pattern has a small lower body, a long upper shadow, and little or no lower shadow. It indicates that the buyers pushed the prices up during the session, but the sellers took over and drove them down near the opening level, signaling a potential reversal.

Figure. 51: Shooting Star Candlestick Pattern Example.
3.51 Short Line Candle
The Short Line Candle is a small-bodied candlestick with short shadows, indicating a period of consolidation or minor price movement.
This pattern, by itself, does not indicate a strong directional bias but can be significant when part of other candlestick formations or when confirming support or resistance levels.
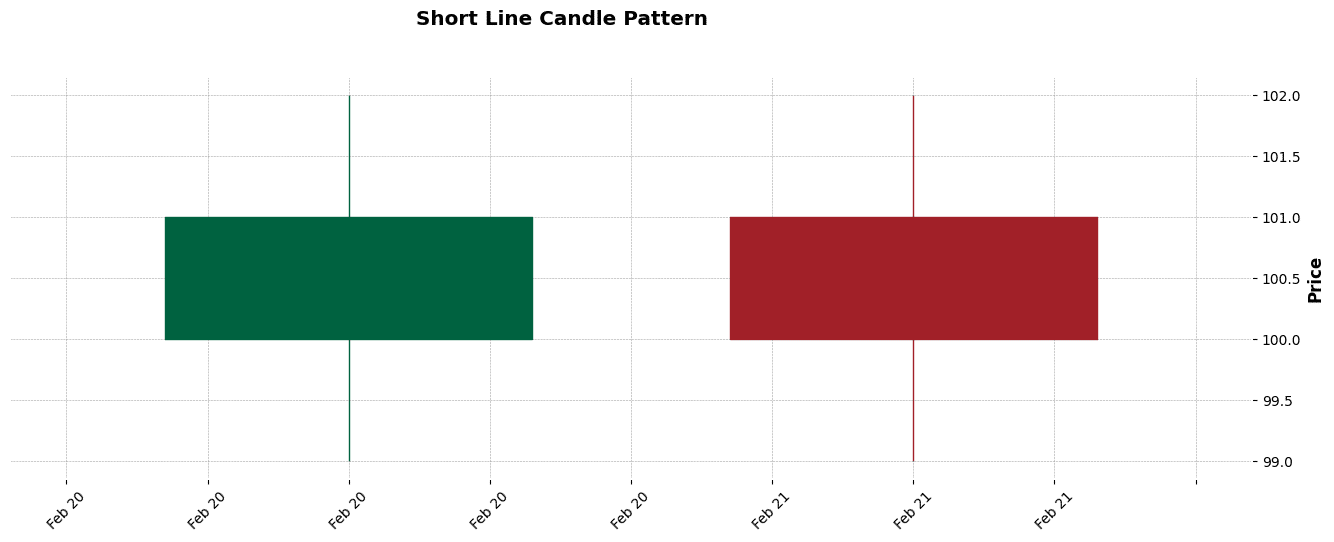
Figure. 52: Short Line Candle Candlestick Pattern Example.
3.52 Spinning Top
The Spinning Top is a candlestick with a small body and long upper and lower shadows, indicating indecision in the market.
The length of the shadows signifies that both buyers and sellers were active, but neither could gain the upper hand. Spinning Tops are important for signaling potential reversals or continuations in the market.
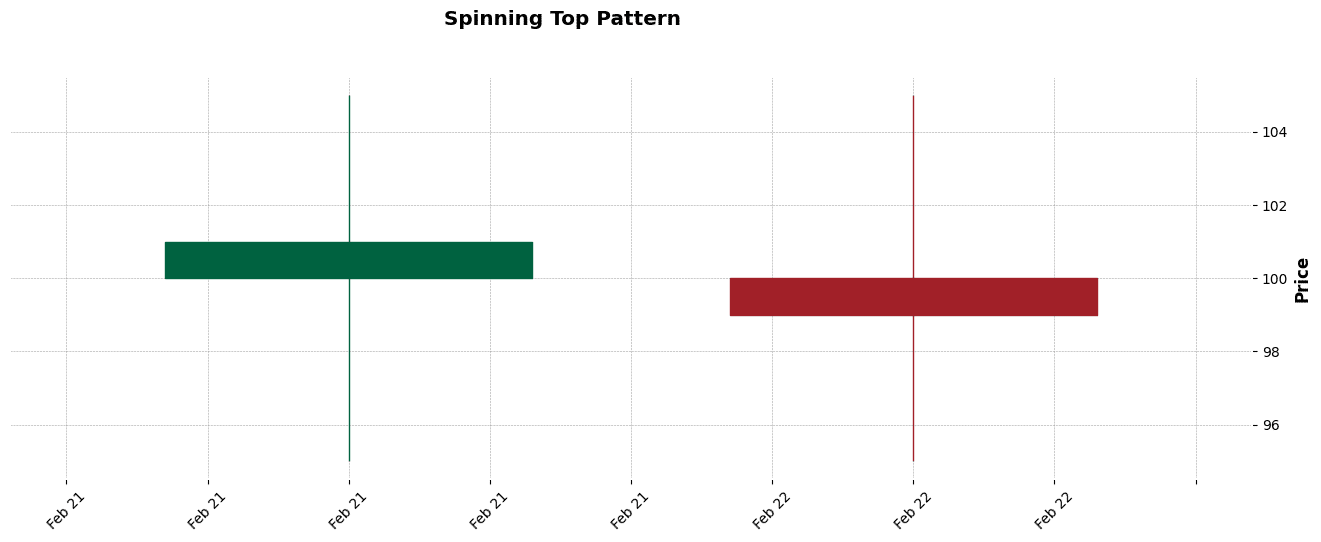
Figure. 53: Spinning Top Candlestick Pattern Example.
3.53 Stalled
The Stalled Pattern is a bearish reversal pattern that appears during an uptrend. It is characterized by three consecutive white (or green) candles, each with a smaller body than the previous.
The third candle in the pattern is a Doji or a spinning top, indicating a loss of momentum and possible hesitation among buyers, suggesting a potential reversal of the uptrend.
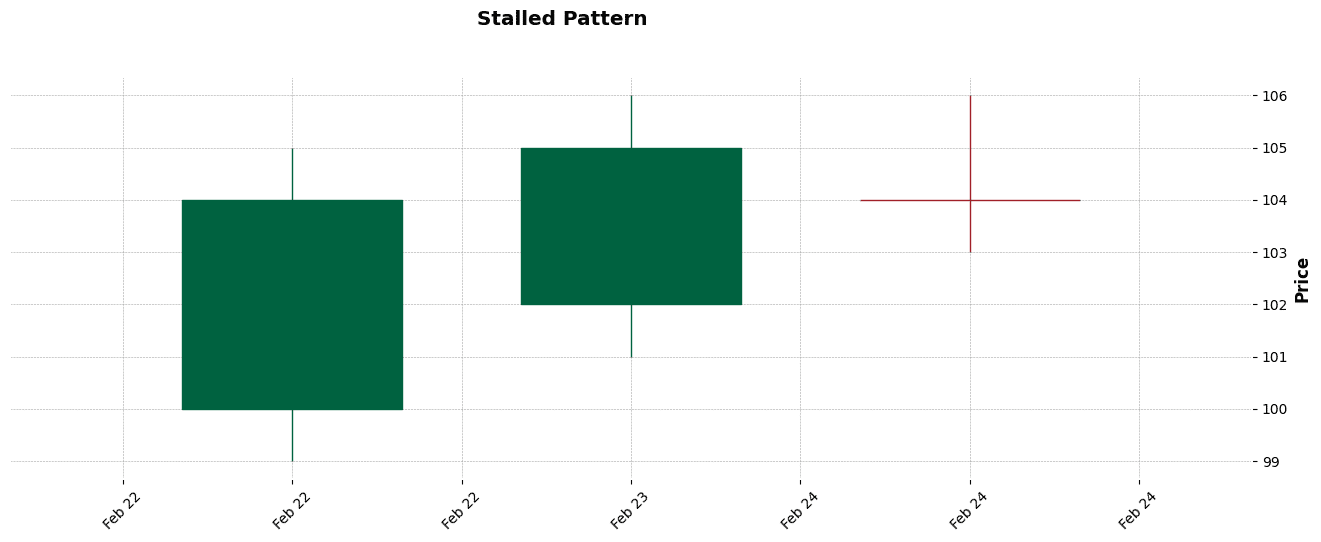
Figure. 54: Stalled Candlestick Pattern Example.
3.54 Stick Sandwich
The Stick Sandwich is a bullish reversal pattern that occurs at the end of a downtrend. It consists of three candles: two black (or red) candles with a white (or green) candle in between.
Both black candles close at or near the same price level, with the white candle closing higher than the black ones. This pattern suggests a potential bullish turnaround.
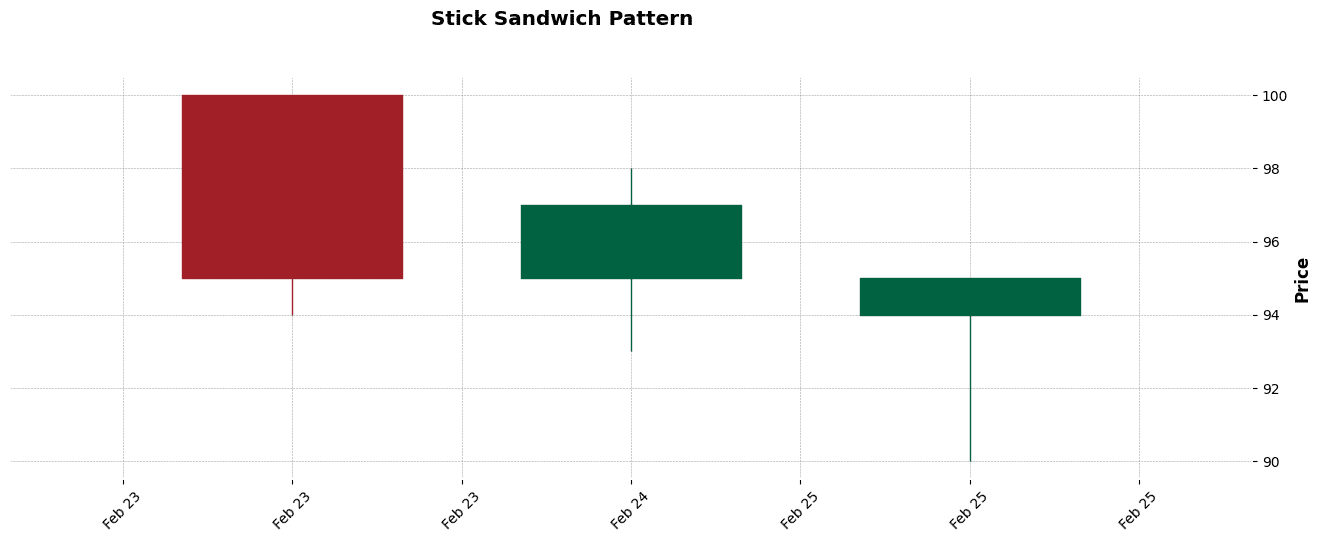
Figure. 55: Stick Sandwich Candlestick Pattern Example.
3.55 Takuri (Dragonfly Doji with very long lower shadow)
The Takuri, or Dragonfly Doji with a very long lower shadow, is a bullish reversal pattern found at the bottom of downtrends.
It features a long lower shadow and a small or nonexistent upper shadow, indicating that the day’s trading pushed the price down significantly, but it closed near the opening price, suggesting strong buying interest at lower levels.
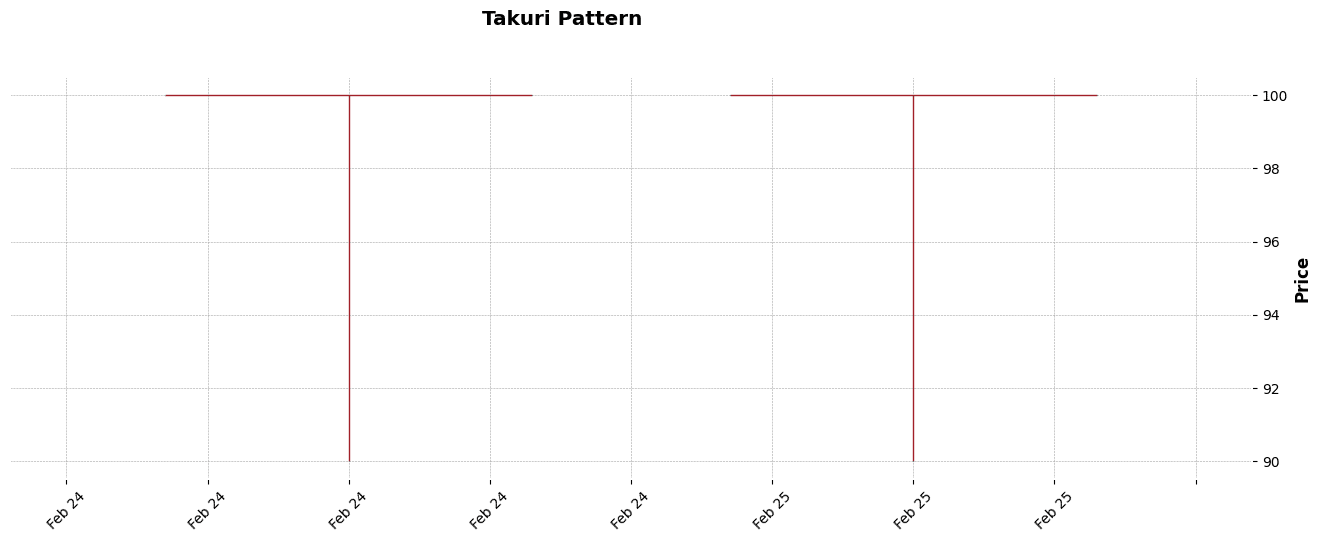
Figure. 56: Takuri Candlestick Pattern Example.
3.56 Tasuki Gap
The Tasuki Gap is a continuation pattern that occurs in both uptrends and downtrends.
In an uptrend, it consists of a white (or green) candle followed by another white candle that gaps up, and then a black (or red) candle that partially fills the gap but does not close it, indicating the continuation of the uptrend.
Morover, the downtrend version features black candles and a white candle with a downward gap.
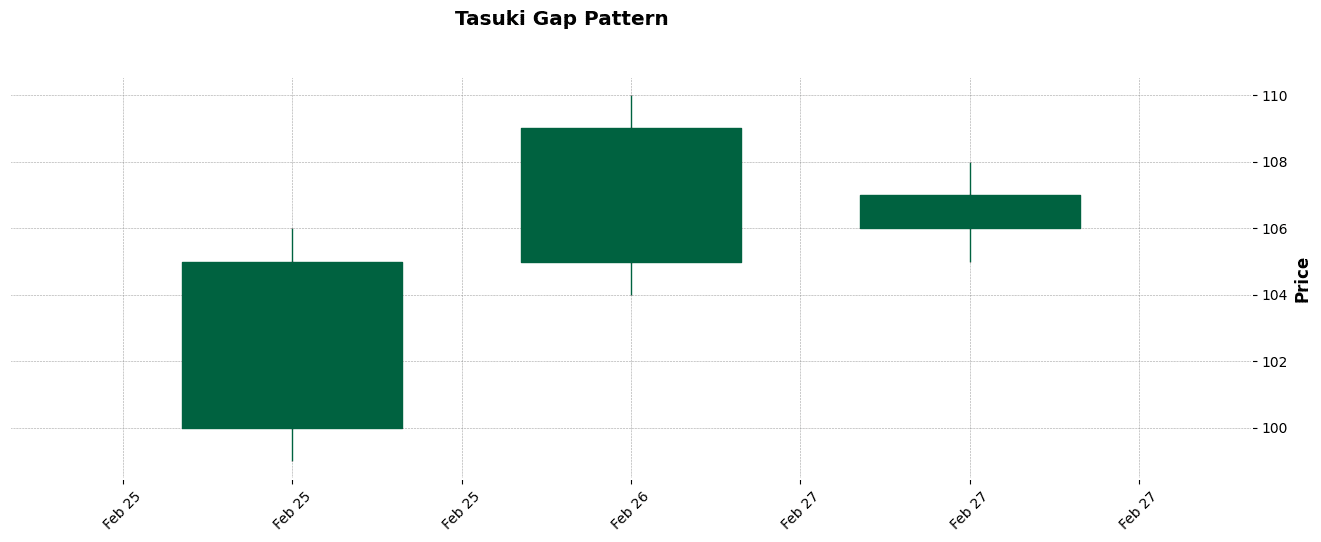
Figure. 57: Tasuki Gap Candlestick Pattern Example
3.57 Thrusting
The Thrusting Pattern is a bearish continuation pattern that appears in a downtrend. It is composed of two candles: the first is a long black (or red) candle, followed by a smaller black candle that opens within the body of the first candle and closes above the midpoint but below the high of the first candle. This pattern suggests that bears still have control despite some buying pressure.
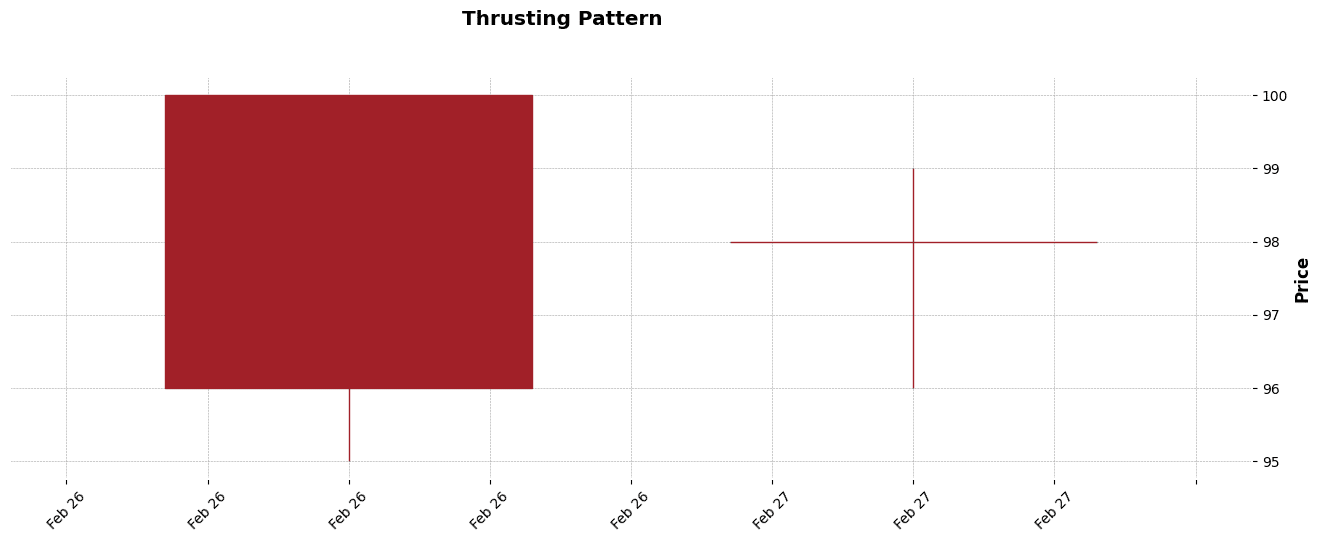
Figure. 58: Thrusting Candlestick Pattern Example
3.58 Tristar
The Tristar Pattern is a rare reversal pattern that can occur at the top or bottom of a trend. It is formed by three consecutive Doji candles, signifying extreme indecision in the market. The pattern suggests a reversal when it appears after a strong trend, indicating a potential shift in market sentiment.
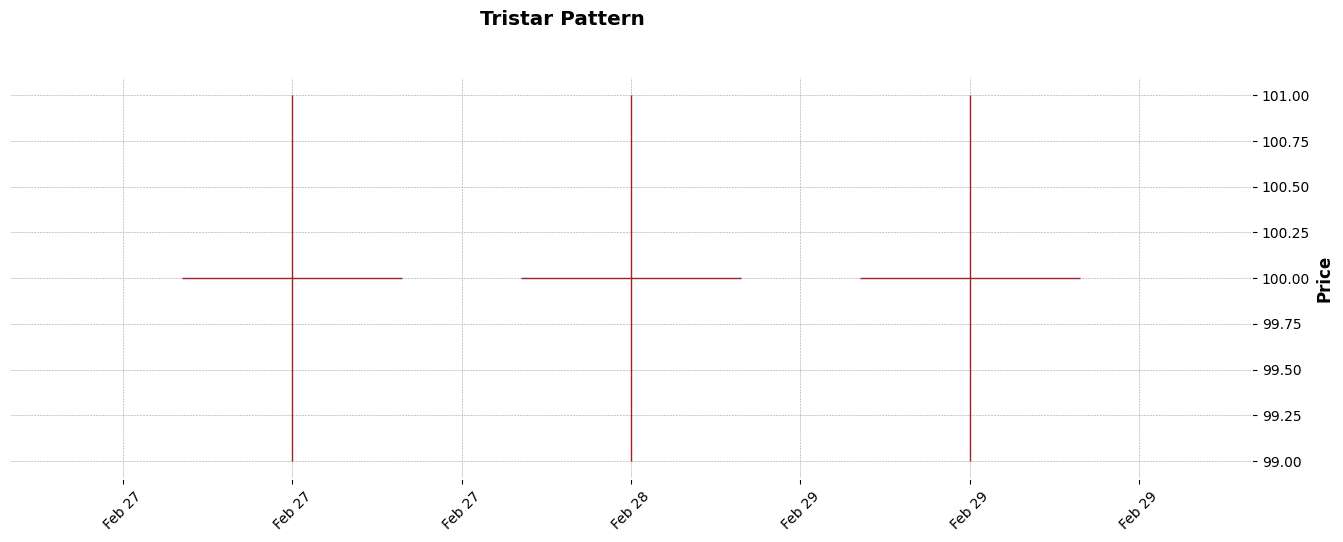
Figure. 59: Tristar Candlestick Pattern Example.
3.59 Unique 3 River
The Unique 3 River is a bullish bottom reversal pattern. It starts with a long black (or red) candle in a downtrend, followed by a smaller black candle with a lower low.
The third candle is a small white (or green) candle that opens within the body of the second candle and closes above its low, suggesting a potential trend reversal.
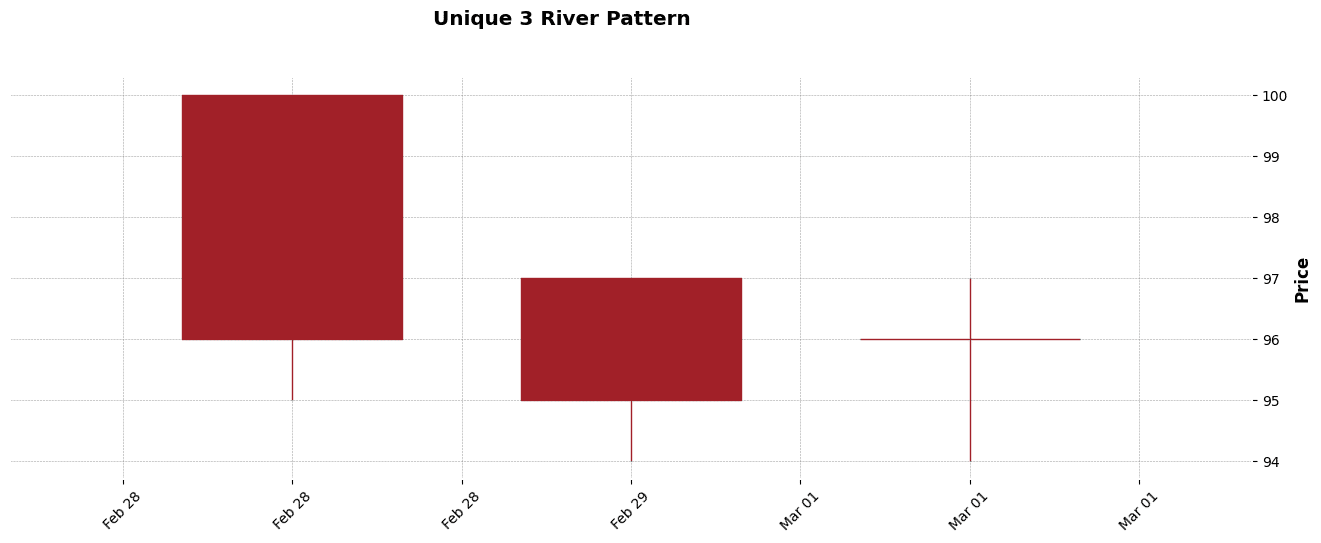
Figure. 60: Unique 3 River Candlestick Pattern Example.
3.60 Upside Gap Two Crows
The Upside Gap Two Crows is a bearish reversal pattern occurring in an uptrend. It starts with a long white (or green) candle, followed by a black (or red) candle that opens with an upside gap and partially fills the gap.
The third candle is another black candle that opens within the body of the second and closes within the body of the first, signifying a potential shift in momentum.
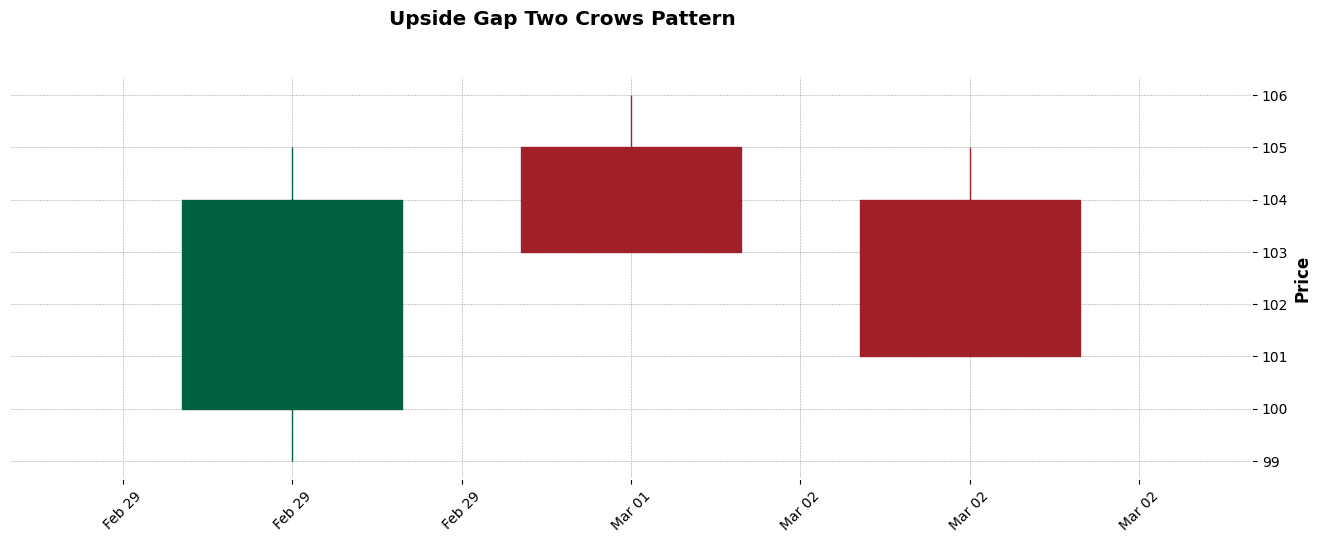
Figure. 61: Upside Gap Two Crows Candlestick Pattern Example.
3.61 Upside/Downside Gap Three Methods
The Upside/Downside Gap Three Methods is a continuation pattern seen in both uptrends and downtrends. In an uptrend, it starts with a long white candle followed by another white candle with an upside gap.
The third candle is a black one that opens higher but closes within the gap, confirming the uptrend. In a downtrend, the colors and gaps are reversed but with the same continuation implication.
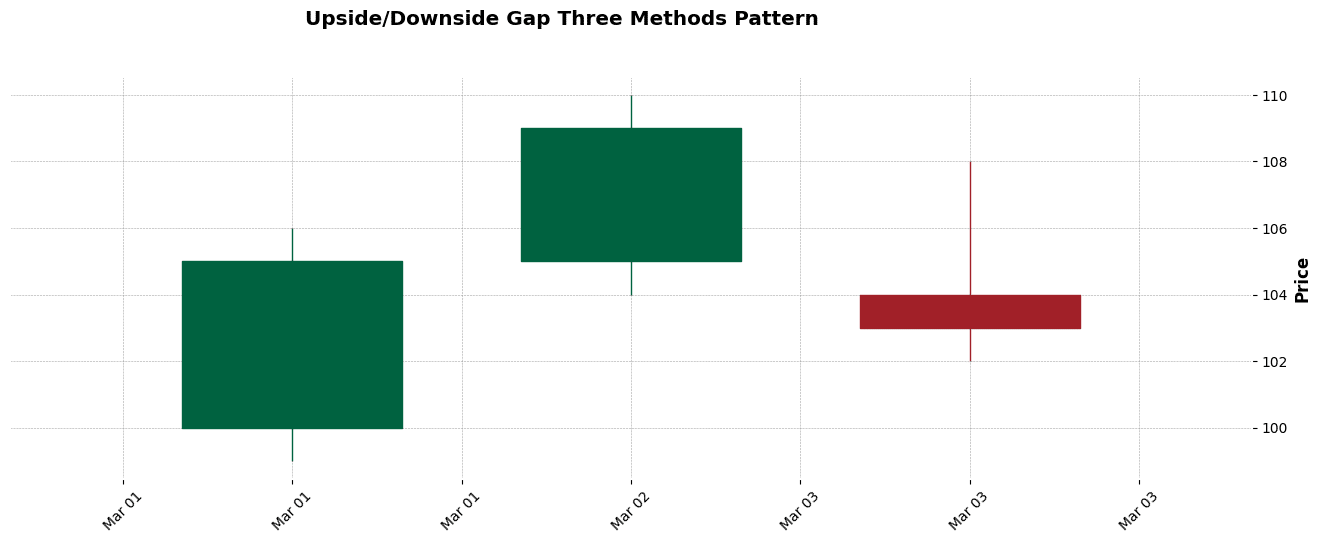
Figure. 62: Upside/Downside Gap Three Methods Candlestick Pattern Example.
4. Challenges and Limitations
In developing the script for candlestick pattern analysis with Python, certain methodological limitations became evident:
- Interpretation Variability: Candlestick patterns are subject to individual interpretation, which can lead to inconsistent trading decisions and compromise the patterns’ objective application.
- Vulnerability to Market Noise: In the face of market volatility, candlestick patterns may emit false signals, prompting misguided trades, particularly during events that cause abrupt price changes.
- Conditional Predictive Value: The foresight offered by candlestick patterns is conditional, requiring corroboration from additional technical indicators or fundamental analysis to solidify their predictive validity.
- Overfitting Concerns: Heavy dependence on historical patterns for market prediction risks overfitting, where models are finely tuned to past data at the expense of their adaptability and accuracy in real-world trading.
Related Articles
Top 36 Moving Average Methods For Stock Prices in Python

Newsletter