Detect and Visualize Key Candlestick Patterns in Asset Prices
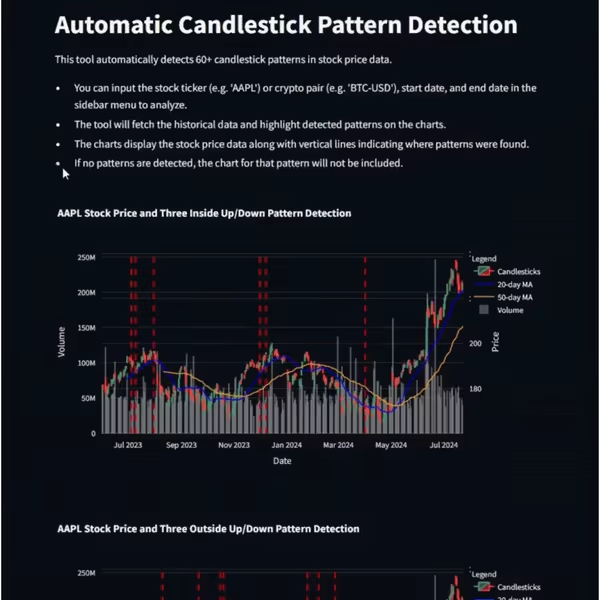
Automated Pattern Detection
This tool is engineered to automatically detect candlestick patterns in stock and cryptocurrency data. Input your asset symbol, specify the date range, and receive detailed insights and visualizations.
Comprehensive Pattern Library
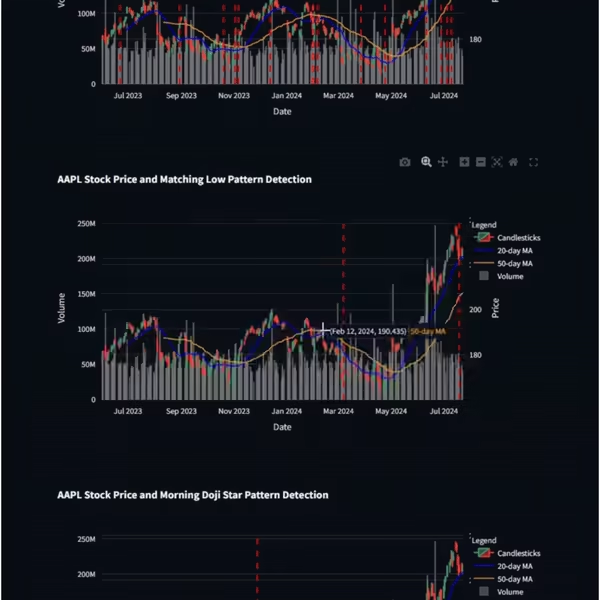
We offer a vast collection of candlestick patterns, including popular ones like Doji, Hammer, and Engulfing. Each pattern is automatically detected and highlighted on the price charts.
Patterns in Real-time
Historical and current candlestick patterns are flagged to the user in real-time. This allows for immediate action based on the latest market data.
Key Features
Extensive Data Coverage: Access comprehensive historical and real-time data.
Customizable Analysis: Tailor your analysis by selecting candlestick patterns to identify or run the detection algorithms on all patterns.
Detailed Visualizations: View charts that highlight dates where patterns were identified, including zoomed-in views of the specific patterns and dates.