Measuring Market Breadth and Momentum
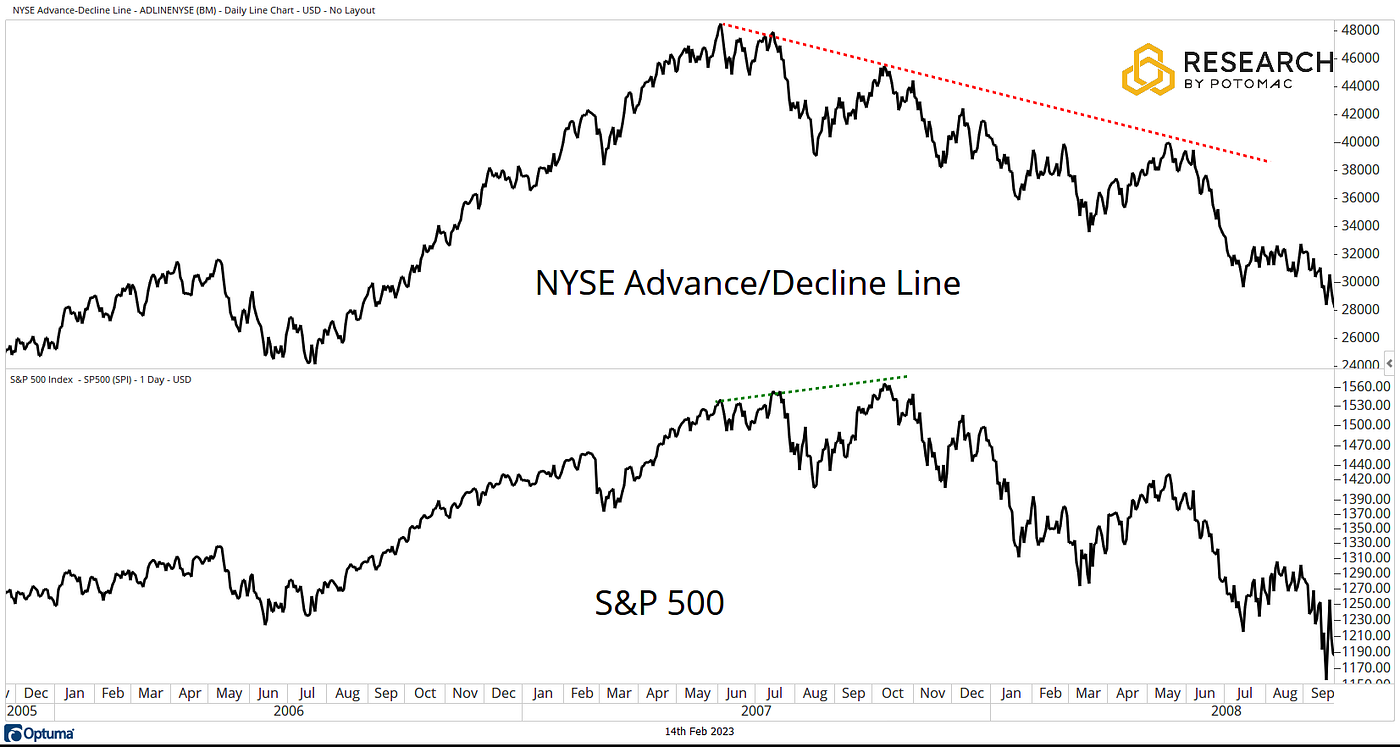
Figure 1. The NYSE Advance Decline Line diverges from the S&P 500 during 2007–2008. While the index reaches new highs, underlying participation weakens. Source: Potomac.
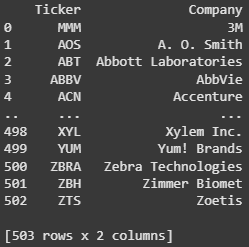
Figure 2. List of All the tickers included in the S&P 500.

Newsletter
Get Every Weekly Update & Insights
[mc4wp_form id=]