Experience the Future of Intelligent Investing Today
Back To Top
Experience the Future of Intelligent Investing Today
The stock market can be a tricky place. But some tools and indicators can help to make sense of it. One worth mentioning is the ‘Volume Ratio’ — a handy little metric to pinpoint unusual volume activity at any given moment. It offers insights into a stock’s momentum, and when paired with directional indicators, can provide further evidence of future movements.
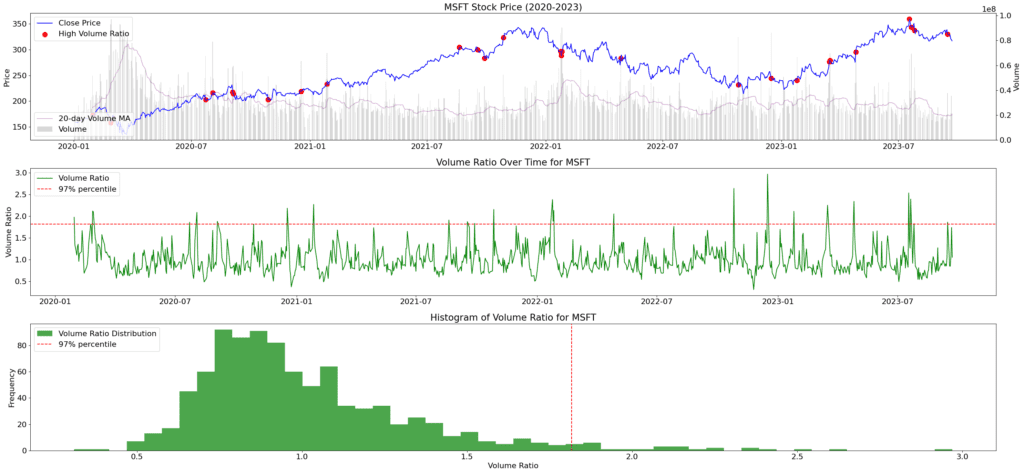
In this article, we’ll discuss why volume is crucial in stock trading, why the volume ratio can be a big deal, and how you can use Python to put it all to work. By the end of this, you’ll have a nifty Python script in your toolkit, helping you get more out of the volume ratio to make more informed trading decisions. The image below provides a preview of the analytical output discussed in this article.

Volume refers to the quantity of shares traded within a designated time frame. It serves as an integral metric, reflective of market activity. High trading volumes typically signify robust market engagement, while disparities or fluctuations in volume might signal notable market deviations to investigate further.
Essentially, volume acts as an indicator of a stock’s momentum. For instance, when there’s substantial price movement accompanied by low volume, it suggests limited market conviction behind that movement. Conversely, a significant price shift backed by high volume indicates a more pronounced and possibly enduring market trend.
While raw volume values are informative, they can sometimes give a skewed understanding if analyzed in isolation. The Volume Ratio rectifies this by offering a standardized insight. Conceptually, the calculation is straightforward:

Equation. 1: Volume Ratio Formula.
The Volume Ratio evaluates how the current trading volume compares to its recent historical average. This assessment contextualizes volume data, offering insights into the evolving momentum of a stock. The significance of this? Elevated volume ratios can act as precursors to notable stock price shifts.
A volume ratio substantially greater than 1 implies that the trading volume for a given period surpasses its typical range. Such deviations often allude to external events or influences spurring heightened trading, which might precede significant price escalations or reductions.
To put it succinctly, while volume presents a snapshot of market activity, the Volume Ratio delineates its pattern, equipping traders with a deeper understanding of potential anomalies in trading activity. These anomalies are particularly evident at the tail of the volume ratio distribution as we will see later.
In our implementation, we’ll be utilizing three essential libraries: pandas, matplotlib, and yfinance.
pandasTo streamline the management datasets.matplotlib To transforms our data into insightful visual charts.yfinance to integrate Yahoo Finance with Python, providing effortless access to both current and past stock dataFor our example, we’ll analyze Microsoft (MSFT), focusing on data from January 1, 2020, to December 22, 2023.
					ticker = 'MSFT'
percentile_threshold = 0.97
data = yf.download(ticker, start='2020-01-01', end='2023-12-22')
Now, compute the 50-day and 200-day moving averages for the Close price (these are primarily for additional insights), followed by the 20-day moving average for volume, and.
					data['50_day_MA'] = data['Close'].rolling(window=50).mean()
data['200_day_MA'] = data['Close'].rolling(window=200).mean()
data['Volume_MA20'] = data['Volume'].rolling(window=20).mean()
data['Volume_Ratio'] = data['Volume'] / data['Volume_MA20']
Let’s represent the stock’s dynamics visually. We’ll plot Microsoft’ stock price, its volume ratio timeline, and a histogram of the Volume Ratio values.
Our main chart shows the stock price and indicates high Volume Ratio days. The secondary visuals focus on the evolution and distribution of the Volume Ratio, emphasizing moments that breach our set threshold.

Newsletter