Experience the Future of Intelligent Investing Today
Back To Top
Experience the Future of Intelligent Investing Today
When diving into the financial world, understanding stock price movements is a significant advantage. Here, we present an interactive method that offers insights into the likelihood of stock prices hitting certain targets, based on historical data.
Leveraging Python’s powerful libraries, this tool is both informative and visually captivating. The presented tool doesn’t predict future prices but assesses the historical frequency of price swings, letting you visualize how often, historically, a stock hit certain price changes over a specified period.
Our default stock for illustration is VOW.DE, representing Volkswagen AG. The time frame chosen spans from 2000 to 2023
The methodology is rooted in historical data analysis. The primary steps include:
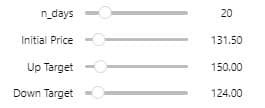
n_days.Users are facilitated to modify several parameters:
n_days) for which the price change is evaluated.up_target) and downward (down_target) price thresholds.Such customizations enable varied analytical perspectives based on differing scenarios.

Figure 1. Interactive sliders in action: Tailoring the analysis parameters to delve deeper into stock price movement patterns
At the heart of this tool lies the logic to compute the probabilities of stock price movements:
					# Calculate the thresholds for price change
up_threshold = round(abs((up_target - initial_price) / initial_price), 3)
...
up_frequency = up_periods / total_periods
Here, the tool:
n_days).The visual component is twofold:
					fig, (ax1, ax2) = plt.subplots(2, 1, figsize=(24, 8))
...
plt.show()
The tool’s charm lies in its interactivity:
					n_days_slider = widgets.IntSlider(...)
...
interact(estimate_probability, n_days=n_days_slider, ...);
Here, ipywidgets empowers users to adjust parameters, such as the target price or number of days. The interact function ties these interactive elements to the core logic, enabling users to receive instant visual feedback as they modify inputs.
For readers eager to have a comprehensive view or run the tool themselves, here’s the full code assembled in one place:

Newsletter