Back To Top

Stock Movement Probability Analysis

What is the Probability that the stock of the stock moving in a given direction?

Probability of Stock Price Movements

Estimates the probability of a stock reaching specified price targets within a given number of days. By analyzing historical price data, the app provides insights into the likelihood of upward or downward price movements, helping traders make informed decisions.

Dynamic Input Parameters

Customize parameters such as the number of days for the analysis, initial stock price, and target prices for upward and downward movements.

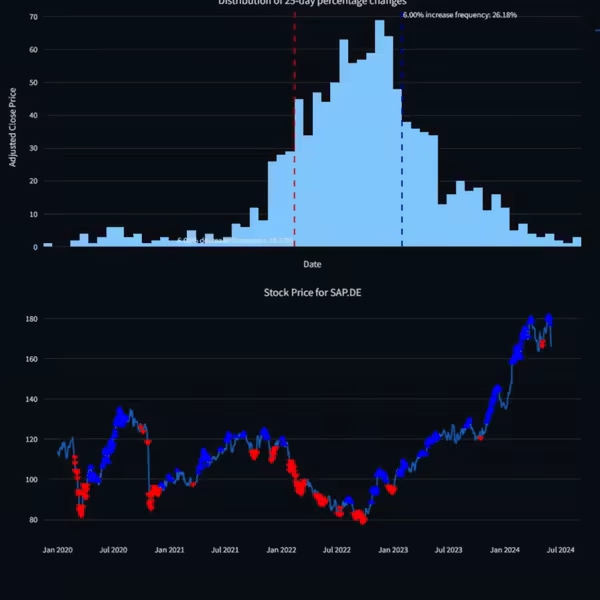
Visualize Key Movement Periods in Stock Prices

The app will display a histogram showing the distribution of percentage changes, with annotations for the frequencies of reaching the up and down targets. A line chart will show the historical adjusted close prices, with markers indicating instances where the price targets were met.

Key Benefits

  • Probability Estimation: Gain insights into the likelihood of a stock reaching specific price targets within a chosen time frame.
  • Historical Analysis: Leverage historical data to inform your trading decisions and strategies.
  • Visual Clarity: Easily interpret data with detailed charts showing distribution of percentage changes and stock price movements.
  • Customizable Parameters: Adjust the number of days, initial price, and target prices to tailor the analysis to your needs.
  • Informed Decision-Making: Use probability estimates to make more informed and strategic trading decisions.
Probability Analysis Tool Entreprenerdly Demo 2
Probability Analysis Tool Entreprenerdly Demo 1

70,000+ Stocks

Driving Analytics for Retail Investors

Monthly

$8/Year

Annual

$75/Year

Free

Free